
Washington, DC (Monday, February 6, 2017) – The Weather Risk Management Association (WRMA) will hold a half-day Weather Risk Management Symposium on March 21, 2017 in conjunction with the 2017 InterMET Asia – Extreme Weather Expo Conference in Singapore.
As an official supporter of the InterMET Extreme Weather Expo Conference, WRMA has compiled an impressive lineup of industry experts to provide attendees a complete treatment of the weather risk industry. The WRMA Weather Risk Management Symposium will begin with an introductory session for those less familiar with the industry, to lend context as to how weather challenges a wide spectrum of businesses whose revenues, costs, and financial performance are sensitive to weather.
“The weather risk management market is positioned at the intersection of the financial engineering and scientific communities,” said Bradley Hoggatt, MSI GuaranteedWeather, WRMA President. “The WRMA symposium is a chance for those in our industry as well as related industries to hear from and engage with weather risk experts.”
The sessions will address key drivers that have shaped the marketplace, predictions regarding future products, and required supporting data and analytics. Speakers will utilize illustrative case study examples to provide perspective and generate discussion as to how new data sources and modelling techniques can facilitate increased hedge effectiveness and uptake of weather risk management products.
Topics and speakers on the agenda for the WRMA Weather Risk Management Symposium include:
• “Weather Risk Management: The Confluence of Weather/Climate Science and Financial Engineering” – Brad Hoggatt, MSI Guaranteed Weather
• “Case Study 1: Managing Weather Risk in the Energy Sector” – Richard Betts, Uniper Global Commodities and Ralph Renner, Endurance Re
• “Case Study 2: Weather Risk Management in the Agriculture Sector Including Applications for Natural Catastrophes” – Sandeep Ramachandran, Axis Specialty Markets Ltd, and Jonathan Barratt, CelsiusPro Australia
• “Case Study 3: Management of Weather Risks in Other Industry Sectors” – Ralph Renner, Endurance Re, Claire Wilkinson, Willis Towers Watson, and Richard Zhang, Willis Towers Watson
• “Technology: Accessing Weather Risk Protection”– David Whitehead, weatherXchange
Download the WRMA Symposium Programme >>
Registration for the free-to-attend WRMA Symposium can be completed via the InterMET Asia website >> and click ‘Register for the Exhibition’.
For more information on the Symposium visit WRMA’s event page >>
For details about the full InterMET – Extreme Weather Expo conference programme, click here >>
About WRMA
WRMA is the industry association for weather risk management professionals. WRMA strives to enhance public awareness of the weather risk industry and promote the growth and general welfare of the weather risk market. For more information on WRMA activities, programs, and initiatives, please visit us at www.wrma.org
Billion-Dollar Weather and Climate Disasters: Overview
(Source: NOAA) The National Centers for Environmental Information (NCEI) is the Nation’s Scorekeeper in terms of addressing severe weather and climate events in their historical perspective. As part of its responsibility of monitoring and assessing the climate, NCEI tracks and evaluates climate events in the U.S. and globally that have great economic and societal impacts. NCEI is frequently called upon to provide summaries of global and U.S. temperature and precipitation trends, extremes, and comparisons in their historical perspective. Found here are the weather and climate events that have had the greatest economic impact from 1980 to 2016. The U.S. has sustained 203 weather and climate disasters since 1980 where overall damages/costs reached or exceeded $1 billion (including CPI adjustment to 2016). The total cost of these 203 events exceeds $1.1 trillion.
2016 in Context…
In 2016, there were 15 weather and climate disaster events with losses exceeding $1 billion each across the United States. These events included a drought event, 4 flooding events, 8 severe storm events, a tropical cyclone event, and a wildfire event. Overall, these events resulted in the deaths of 138 people and had significant economic effects on the areas impacted. The 1980–2016 annual average is 5.5 events (CPI-adjusted); the annual average for the most recent 5 years (2012–2016) is 10.6 events (CPI-adjusted).
Three new billion-dollar disaster events were added during the 4th quarter, bringing the 2016 total to 15 events. This represents the 2nd highest total number of events surpassing the 11 events observed in 2012. The record number of events in one year (since 1980) is 16, as observed in 2011.
The U.S. has also experienced 4 billion-dollar inland flood events during 2016, doubling the previous record, as no more than 2 inland flood events have occurred in a year since 1980. This is a notable record, further highlighted by the numerous other record flooding events that have impacted the U.S. in 2016.
Methodology and Data Sources
In 2012, NCEI — then known as National Climatic Data Center (NCDC) — reviewed its methodology on how it develops Billion-dollar Disasters. NCEI held a workshop with economic experts (May, 2012) and worked with a consulting partner to examine possible inaccuracy and biases in the data sources and methodology used in developing the loss assessments (mid-2013). This ensures more consistency with the numbers NCEI provides on a yearly basis and give more confidence in the year-to-year comparison of information. Another outcome is a published peer-reviewed article “U.S. Billion-dollar Weather and Climate Disasters: Data Sources, Trends, Accuracy and Biases” (Smith and Katz, 2013). This research found the net effect of all biases appears to be an underestimation of average loss. In particular, it is shown that the factor approach can result in an underestimation of average loss of approximately 10–15%. This bias was corrected during a reanalysis of the loss data to reflect new loss totals.
It is also known that the uncertainty of loss estimates differ by disaster event type reflecting the quality and completeness of the data sources used in our loss estimation. In 2016, six of the fifteen billion-dollar events (i.e., the 4 inland flooding events, drought and Hurricane Matthew) have higher potential uncertainty values around the loss estimates due to less coverage of insured assets. The remaining nine events (i.e., 8 severe storm events and wildfire) have lower potential uncertainty surrounding their estimate due to more complete insurance coverage. Our newest research defines the cost uncertainty using confidence intervals as discussed in the peer-reviewed article “Quantifying Uncertainty and Variable Sensitivity within the U.S. Billion-dollar Weather and Climate Disaster Cost Estimates” (Smith and Matthews, 2015). This research is a next step to enhance the value and usability of estimated disaster costs given data limitations and inherent complexities.
In performing these disaster cost assessments these statistics were taken from a wide variety of sources and represent, to the best of our ability, the estimated total costs of these events — that is, the costs in terms of dollars that would not have been incurred had the event not taken place. Insured and uninsured losses are included in damage estimates. Sources include the National Weather Service, the Federal Emergency Management Agency, U.S. Department of Agriculture, other U.S. government agencies, individual state emergency management agencies, state and regional climate centers, media reports, and insurance industry estimates.
References
- Smith, A., and J. Matthews, 2015: Quantifying Uncertainty and Variable Sensitivity within the U.S. Billion-dollar Weather and Climate Disaster Cost Estimates. Natural Hazards.
DOI: 10.1007/s11069-015-1678-x - Smith, A., and R. Katz, 2013: U.S. Billion-dollar Weather and Climate Disasters: Data Sources, Trends, Accuracy and Biases. Natural Hazards.
DOI: 10.1007/s11069-013-0566-5 - Lott, N., and T. Ross, 2006: Tracking and evaluating U. S. billion dollar weather disasters, 1980-2005. Preprints. AMS Forum: Environmental Risk and Impacts on Society: Successes and Challenges, Atlanta, GA, Amer. Meteor. Soc., 1.2.
- Lott, N., and T. Ross, 2003: A Climatology of 1980-2003 Extreme Weather and Climate Events, Technical Report.
Citing this information:
NOAA National Centers for Environmental Information (NCEI) U.S. Billion-Dollar Weather and Climate Disasters (2017). https://www.ncdc.noaa.gov/billions/
Trump’s orders spell winds of change for automakers to renewable energy
It’s been just 11 days since Donald Trump was inaugurated in the US and so far the new president seems set on solidifying the promises he made during his campaign, including some that would impact climate and energy.
The 1,000-mile long wall that Trump intends to build between the US and Mexico would release as much as 1.9m tonnes of carbon dioxide into the atmosphere if it were to be built out of concrete, according to an estimate from Columbia University. Trump signed an executive order last Wednesday to direct the construction of such a wall and to boost the number of patrol forces along it.
Meanwhile, another executive order signed over the weekend to halt immigration from seven Middle Eastern countries could have an impact on companies from General Electric to General Motors – both of which employ immigrants from the nations affected. “We have many employees from the named countries and we do business all over the region,” said Jeff Immelt, CEO of GE, in an internal email. GE is one of the world’s leading wind turbine manufacturers and in 2015 almost 14% of its revenue came from the Middle East and Africa, according to Bloomberg data. GM, maker of the all-electric Chevrolet Bolt and Volt plug-in hybrid, has vast manufacturing operations in Michigan – a state with a substantial Muslim population.
Trump is also likely to follow through on his intention to pull the US out of the landmark climate pact signed by more than 190 nations in Paris in December 2015, according to Myron Ebell, who headed Trump’s Environmental Protection Agency transition team. “President Trump made it clear he would withdraw from the deal,” Ebell said during a press conference in London yesterday. As the world’s richest nation and second largest polluter, US participation in the accord is fundamental to limiting global warming, say climate researchers.
One area that might survive Trump’s protectionist stance is the gas export market between the US and Mexico, according to asset manager ING Groep and Pira Energy Group. Pipeline deliveries of natural gas from the US to Mexico have more than doubled in the past two years, in response to declining oil and gas production in the latter and a supply glut in the former. The market supports jobs in the US and provides Mexico with cheap fuel and so may avert any interventionist measures, say the companies.
In California, large battery storage plants are moving in on the traditional role of natural gas to provide electricity to the grid during peak hours of demand. Three large plants – built by Tesla Motors, AES and Altagas – will go live in southern California this week in order to fill the power glut caused by the natural gas leak at Aliso Canyon in Los Angeles, which was subsequently shut down. The leak emitted 109,000 tonnes of methane into the atmosphere and led to the displacement of thousands of local residents. The battery storage projects have all been completed within six months and will alleviate the risk of winter blackouts.
On the US east coast, the country’s largest offshore wind farm received approval last week, a key milestone on the way to its deployment in waters off Long Island. The 90MW project will generate enough electricity to power 50, 000 homes and is the first step towards New York Governor Andrew Cuomo’s goal to develop 2.4GW of offshore wind by 2030.
In Europe, the offshore wind industry will install more than 3.5GW of capacity this year, according to a forecast by the WindEurope industry group. Germany and the UK will be market leaders – installing more than 1.6GW each, while Belgium will add 165MW and Denmark 23MW. This will add to the continent’s current capacity of 12.6GW of offshore wind.
The market for offshore wind in Polish waters and elsewhere in the Baltic Sea also looks promising, according to a BNEF Research Note that sees a current unfinanced pipeline of as much as 2.5GW. The Baltic region has so far been behind in developing offshore wind due to a lack of supportive policy, low power prices and a ready supply of hydro-electric and nuclear power. Nevertheless, Poland has an auction on the cards for 2017 and at least 200MW of capacity could be commissioned in the country by 2022, the note says.
Taiwan’s market for offshore wind is also heating up following news last week that Dong Energy and Macquarie Capital had both bought stakes in the country’s first commercial-scale offshore project – the 128MW Formosa I wind farm. Macquarie now owns half the project, Dong Energy holds 35% and the initial developer — Swancor Renewable – holds the remainder. Formosa I is expected to be fully built in 2019, subject to a final investment decision.
India’s solar installations to escalate from 2017 onwards (GW of capacity) |
 |
| Source: Bloomberg New Energy FinanceIndia added 3.85GW of grid-connected solar generation capacity in the first 10 months of 2016 — almost double total installations in 2015. BNEF has revised its projections for subsequent years based on the amount of capacity auctioned in 2016 and anticipated installations in the future. States will be under increasing pressure to meet the renewable purchase obligation targets set out at federal level, which require 6.75% of total electricity consumption across all states to come from solar-powered generation by the end of 2019. |
Climate change poses increasingly severe risks for ecosystems, human health and the economy in Europe
25 Jan 2017: Europe’s regions are facing rising sea levels and more extreme weather, such as more frequent and more intense heatwaves, flooding, droughts and storms due to climate change, according to a European Environment Agency report published today. The report assesses the latest trends and projections on climate change and its impacts across Europe and finds that better and more flexible adaptation strategies, policies and measures will be crucial to lessen these impacts.
Image © JanJBrand/iStockphoto
‘Climate change will continue for many decades to come. The scale of future climate change and its impacts will depend on the effectiveness of implementing our global agreements to cut greenhouse gas emissions, but also ensuring that we have the right adaptation strategies and policies in place to reduce the risks from current and projected climate extremes.’
Hans Bruyninckx, EEA Executive Director
The observed changes in climate are already having wide-ranging impacts on ecosystems, the economy and on human health and well-being in Europe, according to the report ‘Climate change, impacts and vulnerability in Europe 2016’. New records continue to be set on global and European temperatures, sea levels and reduced sea ice in the Arctic. Precipitation patterns are changing, generally making wet regions in Europe wetter and dry regions drier. Glacier volume and snow cover are decreasing. At the same time, climate-related extremes such as heat waves, heavy precipitation and droughts, are increasing in frequency and intensity in many regions. Improved climate projections provide further evidence that climate-related extremes will increase in many European regions.
‘Climate change will continue for many decades to come. The scale of future climate change and its impacts will depend on the effectiveness of implementing our global agreements to cut greenhouse gas emissions, but also ensuring that we have the right adaptation strategies and policies in place to reduce the risks from current and projected climate extremes,’ said Hans Bruyninckx, EEA Executive Director.
‘Climate change will continue for many decades to come. The scale of future climate change and its impacts will depend on the effectiveness of implementing our global agreements to cut greenhouse gas emissions, but also ensuring that we have the right adaptation strategies and policies in place to reduce the risks from current and projected climate extremes,’ said Hans Bruyninckx, EEA Executive Director.
Climate change hotspots
All European regions are vulnerable to climate change, but some regions will experience more negative impacts than others. Southern and south-eastern Europe is projected to be a climate change hotspot, as it is expected to face the highest number of adverse impacts. This region is already experiencing large increases in heat extremes and decreases in precipitation and river flows, which have heightened the risk of more severe droughts, lower crop yields, biodiversity loss and forest fires. More frequent heat waves and changes in the distribution of climate-sensitive infectious diseases are expected to increase risks to human health and well-being.
Coastal areas and floodplains in western parts of Europe are also seen as hotspots as they face an increased risk of flooding from rising sea levels and a possible increase in storm surges. Climate change is also leading to major changes in marine ecosystems as a result of ocean acidification, warming and the expansion of oxygen-depleted dead zones.
Ecosystems and human activities in the Arctic will also be strongly affected owing to the particularly rapid increase in air and sea temperatures and the associated melting of land and sea ice.
Although some regions may also experience some positive impacts, such as improving conditions for agriculture in parts of northern Europe, most regions and sectors will be negatively affected.
Map ES.1 Key observed and projected climate change and impacts for the main biogeographical regions in Europe

Ecosystems, human health and economy
Ecosystems and protected areas across Europe are under pressure from climate change and other stressors, such as land use change. The report highlights that the impacts of climate change are a threat to biodiversity at land and in the seas. Many animal and plant species are experiencing changes to their life cycles and are migrating northwards and to higher altitudes, while various invasive species have established themselves or have expanded their range. Marine species, including commercially important fish stocks, are also migrating northwards. These changes affect various ecosystem services and economic sectors such as agriculture, forestry and fisheries.
The main health effects of climate change are linked to extreme weather events, changes in the distribution of climate-sensitive diseases, and changes in environmental and social conditions. River and coastal flooding has affected millions of people in Europe in the last decade. The health effects include injuries, infections, exposure to chemical hazards and mental health consequences. Heatwaves have become more frequent and intense, leading to tens of thousands of premature deaths in Europe. This trend is projected to increase and to intensify, unless appropriate adaptation measures are taken. The spread of tick species, the Asian tiger mosquito and other disease carriers increases the risk of Lyme disease, tick-borne encephalitis, West Nile fever, dengue, chikungunya and leishmaniasis.
The economic costs of climate change can be very high. Climate-related extreme events in EEA member countries account for more than EUR 400 billion of economic losses since 1980. Available estimates of the future costs of climate change in Europe consider only some sectors and show considerable uncertainty. Still, the projected damage costs from climate change are highest in the Mediterranean region. Europe is also affected by climate change impacts occurring outside Europe through trade effects, infrastructure, geopolitical and security risks, and migration.
Enhancing adaptation and knowledge
Mainstreaming of climate change adaptation into other policies is progressing but can be further enhanced. Other possible further actions include improving policy coherence across different policy areas and governance levels (EU, transnational, national and subnational), more flexible adaptive management approaches, and the combination of technological solutions, ecosystem-based approaches and ‘soft’ measures.
The development and use of climate and adaptation services are increasing in Europe. Improved knowledge would be useful in various areas, for example, on vulnerability and risk assessments at various scales and on monitoring, reporting and evaluation of adaptation actions, their costs and benefits, and synergies and trade-offs with other policies.
Background
The report is an indicator-based assessment of past and projected climate change and its impacts on ecosystems and society. It also looks at society’s vulnerability to these impacts and at the development of adaptation policies and the underlying knowledge base.
The report was developed by the EEA in collaboration with the Joint Research Centre of the European Commission, the European Centre for Disease Prevention and Control, the World Health Organisation Regional Office for Europe and three European Topic Centres (ETC-CCA, ETC-BD, ETC-ICM). This is the fourth ‘Climate change, impacts and vulnerability in Europe’ report, which is published every four years. This edition aims to support the implementation and review process of the 2013 EU Adaptation Strategy, which is foreseen for 2018, and the development of national and transnational adaptation strategies and plans.
Turbulence expert reveals cost of climate change to aviation insurers
Climate change could hit insurers by making plane journeys bumpier, a University of Reading scientist has told an audience of leading insurers.
The Insurance Institute of London lecture at Lloyds of London on Wednesday 18 January, was attended by the City’s leading insurance players including CEOs, managing directors, brokers, underwriters, and lawyers.
Atmospheric scientist Dr Paul Williams, a Royal Society University Research Fellow, told the audience in Lloyds’ Old Library about the likelihood of increased turbulence and more extreme weather.
Research by Dr Williams has shown that planes travelling from Europe to North America could face an increased chance of hitting turbulence by as much as 170% later this century. This is because climate change will strengthen instabilities within the jet stream – a high-altitude wind blowing from west to east across the Atlantic Ocean. The turbulence could also be up to 40% stronger.
Diverting around the additional turbulence has the potential to lengthen journeys and increase fuel burn, which could add to ticket prices and also contribute to climate change, completing a vicious circle.
“Increased turbulence and flight times could have a knock-on effect on passengers and the aviation and insurance industries”
Dr Williams said: “The aviation industry is facing pressure to reduce its environmental impact, but our work has shown how aviation is itself susceptible to the effects of climate change.
“Increased turbulence and flight times could have a knock-on effect on passengers and the aviation and insurance industries.”
Dr Williams’ work is part of a wider body of research by University of Reading experts into the interaction of aviation and atmospheric physics.
For example, research by Professor Keith shine and Dr Emma Irvine has shown that condensation trails, or contrails, formed behind aircraft flying at high altitude, can also add to global warming by adding to cloud cover, which prevents heat from escaping Earth’s atmosphere.
Researchers at Reading have also been central to efforts to study the spread of volcanic ash in the upper atmosphere. Their work helped to aid the safe resumption of flights after the grounding of all UK air traffic following the eruption of a volcano in Iceland in April 2010.
Watch Dr Williams explain why turbulence could increase in this video.
Find out why flights to the US could take longer in this video.
Flood most damaging peril of 2016, causing nearly one-third of $210bn global economic losses – according to Aon catastrophe report
Aon Benfield’s catastrophe model development team, today launches its 2016 Annual Global Climate and Catastrophe Report, which evaluates the impact of the natural disaster events that occurred worldwide during the last 12 months to promote awareness and enhance resilience. Aon Benfield is the global reinsurance intermediary and capital advisor of Aon plc (NYSE:AON).
The report reveals that there were 315 natural catastrophe events in 2016 that generated economic losses of USD210 billion. For historical context, 2016 was the seventh highest year on record with the combined economic loss exceeding the USD200 billion threshold for the first time since 2013.
The top three perils—flooding, earthquake and severe weather—combined for 70 percent of all economic losses in 2016. While at least 72 percent of catastrophe losses occurred outside of the United States, it still accounted for 56 percent of global insured losses.
Overall, just 26 percent (USD54 billion) of overall economic losses were covered by insurance in 2016 due to a higher percentage of damage occurring in areas with a lower insurance penetration. However, the public and private insurance industry losses were 7 percent above the 16-year average and the highest insured loss total since 2012. 2016 marked the end of a four-year downward trend since the record year in 2011.
There were at least 34 natural disasters that caused more than USD1.0 billion in economic damage around the globe, though just 11 of those events had insurable losses reach the same threshold. The vast majority of the billion-dollar events (30) were weather-related, and only nine had insured losses at or above USD1.0 billion.
Steve Bowen, Impact Forecasting director and meteorologist, said: “After a decline in catastrophe losses during the previous four years, 2016 marked a bit of an uptick in natural peril costs to the global economy. When recognizing that we have seen a nominal increase in both annual and individual weather disaster costs in recent decades, we recognize that factors such as climate change, more intense weather events, greater coastal exposures and population migration shifts are all contributors to the growing trend. With these parameters in place, and forecasts continuing to signal greater risk and vulnerability, it is anticipated that weather-related catastrophe losses will further increase in the coming years. The data and analysis in this report will help businesses, communities, governments and the re/insurance industry to better prepare and help mitigate the growing risks of these disasters.”
Notable events driving economic and insured losses in 2016 included:
- A series of April earthquakes in Japan was the costliest event both economically (USD38 billion in losses) and for the insurance industry (USD5.5 billion)
- Six of the top 10 costliest insured loss events occurred in the United States, including Hurricane Matthew and multiple severe weather outbreaks
- For the fourth consecutive year, flooding was costliest overall peril at USD62 billion (30% of the total). The most significant flood events were along the Yangtze River basin in China (USD28 billion in damage) and in the US state of Louisiana (USD10-15 billion in losses).
- A notable entry into the top five insured losses was for a ‘secondary’ peril – wildfire – in Fort McMurray, Canada that cost the industry nearly USD3.0 billion.
- The United States experienced 14 individual billion-dollar economic loss events and Asia-Pacific experienced 13 such events – compared to four in EMEA and three in the Americas.
Read the full 2016 Annual Global Climate and Catastrophe Report: http://aon.io/2joGyPl
Watch Steve Bowen’s short film on the key findings of the report, shot in St. Augustine, Florida which was impacted by Hurricane Matthew. https://youtu.be/-sz2ASRi8yQ
Access current and historical natural catastrophe data, plus event analysis, on Impact Forecasting’s Catastrophe Insight website.
Further information
For further information please contact the Aon Benfield team: Alexandra Lewis (+44 207 086 0541) or David Bogg
Follow Aon on Twitter: https://twitter.com/Aon_plc
For information on Aon plc. and to sign-up for news alerts: http://aon.mediaroom.com
Notes to editors
| Top 10 Global Economic Loss Events | ||||||
| Date(s) | Event | Location | Deaths | Economic Loss (USD) | Insured Loss (USD) | |
| April 14 & 16 | Earthquake | Japan | 154 | 38 billion | 5.5 billion | |
| Summer | Flooding | China | 475 | 28 billion | 750 million | |
| Sept. 28 – Oct. 10 | HU Matthew | US, Caribbean | 605 | 15 billion | 5.0 billion | |
| August | Flooding | United States | 13 | 10 to 15 billion | 3.0 billion | |
| Yearlong | Drought | China | 0 | 6.0 billion | 200 million | |
| May / June | Flooding & SCS | Western/Central Europe | 20 | 5.5 billion | 3.4 billion | |
| Yearlong | Drought | India | 0 | 5.0 billion | 750 million | |
| August 24 | Earthquake | Italy | 299 | 5.0 billion | 100 million | |
| July | Flooding | China | 289 | 4.7 billion | 200 million | |
| May | Wildfire | Canada | 0 | 4.5 billion | 2.8 billion | |
| ALL OTHER EVENTS | 83 billion | 33 billion | ||||
| TOTALS | 210 billion1 | 54 billion1,2 | ||||
| 1 Subject to change as loss estimates are further developed | ||||||
| 2 Includes losses sustained by private insurers and government-sponsored programs | ||||||
SOURCE Aon Benfield
Top UK climate change scientist talks about President-elect Trump's likely impact
Alexandra Cheung interviews Professor Joanna Haigh, Climate Change and the Environment Co-Director at the Grantham Institute, on how the new United States administration’s policies could affect global research and action on climate change and the environment.
Q. What do we know about what US environmental policy may look like under the incoming Trump administration?
A. At this stage all we have to go on are the statements that various member of the administration have made about their plans. Trump himself seems to have gone back on his earlier declaration that the whole climate change issue was invented by the Chinese to scupper the US economy. But he’s still stated that there’s much to be investigated on climate change, suggesting that he’s not at all convinced.
Trump initially promised that the US would withdraw from the United Nations’ landmark Paris Agreement on climate change, under which all countries have agreed to limit their greenhouse gas into the future, but the incoming Secretary of State, Rex Tillerson, has now indicated that he believes the US should remain part of the Agreement.
This seems to be a shift towards a ‘lukewarmist’ approach whereby former climate change deniers now acknowledge the existence of global warming, and that human activity might be contributing to it, but downplay the magnitude and emphasise uncertainties.
Trump has furthermore suggested that he will rescind various elements of environmental legislation like the Obama Clean Power Plan (which sets out to cut carbon dioxide emissions from the power sector), and he would probably approve a new 1,900 km oil pipeline which crosses native American reservations. But of course none of that is written in black and white, we’ll have to wait and see.
Q. Technically speaking, could the US pull out of the Paris Agreement?
A. Trump’s position on the Paris Agreement remains unclear, but if he were to go ahead with withdrawing he would face some legal barriers. It seems that it would take four years for any nation to fully pull out of the Paris Agreement. But merely being part of the agreement isn’t the same as actually doing anything to honour your commitments. The US could still go along to all the meetings but essentially do nothing.
Strangely it seems that Trump could pull out of the United Nation Framework Convention on Climate Change (UNFCCC), which is the body that convened the Paris Agreement, in just one year. That would have a far greater impact on how the US is viewed internationally. This might be less likely, however as it could invite a lot of diplomatic action from the other countries
Q. Could other countries compensate by increasing their own emissions cuts?
A. The US is currently responsible for about a fifth of global carbon dioxide emissions, so any complacency on its part would make it much harder for the rest of us to reach global climate targets. At the moment is doesn’t seem that many countries are on track to meet their existing commitments, so hoping that they might do extra is perhaps wishful thinking.
However there are signs that things might go faster as the cost of energy from renewable technologies like solar panels drops, and more and more of our energy comes from sources like wind, and tidal power. We might be able to do better than we planned. But generally speaking, it will already be difficult for countries to meet their own commitments, so expecting them to take on the United States’ as well is a little optimistic.
Q. What could be the effect of withdrawing funding for climate science from federal research institutes like Nasa?
A. The US has made major contributions to climate science over past 40 years and is at forefront of many areas in climate research. Losing this input would be a big hit to the field as a whole. Having said that, there’s good research going on in another countries across the world, which might go some way towards making up for this potential loss.
“So many businesses are beginning to understand that climate change is the biggest risk to the continuity, and their coming together on this issue is a landmark occasion.”
A trickier challenge would be to fill the gap the US would leave in terms of data collection. US scientists, particularly through their satellite projects, supply the global research community with wonderful data on global environmental parameters such as temperature, humidity, concentrations of various gases, cloud cover and wind, which are absolutely fundamental to both weather prediction and understanding climate.
Associated with that is curation of data collated in the past. There are big archives of data, used by scientists across the world for climate change and environmental research. If these data stores were withdrawn that would deliver a huge blow to international research. I’ve heard rumours that people are already carrying out ‘guerrilla archiving’, that is to say transferring large amounts of data onto independent servers.
If there is a scaling back of climate change research in the US it’s possible that the UK and European Union could take on some extra research, but in order to do that they would require extra resources. We can’t do more without more investment. And certainly in UK there has been no suggestion that there will be more funding for science going ahead so I think that’s probably unlikely.
Q. The new US administration’s stance on climate change seems to be a cause for concern, but could it bring about any positive outcomes?
A. If the US drags its feet it might provide a boost to other countries to think they can do more on climate change. After the Kyoto climate change accord was adopted in 1997, both Canada and the US withdrew. But there was a subsequent surge of activity, led by emerging economies, which resulted in a lot more action than might otherwise have been anticipated.
Additionally, the US might leave behind a gap in the market in terms of developing low-carbon technologies and that might spur other countries to take advantage of this opportunity. So many businesses are beginning to understand that climate change is the biggest risk to the continuity, and their coming together on this issue is a landmark occasion. There is also an opportunity for the military wings of governments to work together to prevent climate change impacting so disproportionately on people from war-torn regions.
Source: Grantham Institute and Imperial College London. Article text provided under an Attribution-NonCommercial-Share Alike Creative Commons license.
ClimateWise launches two reports that warn of growing protection gap due to rising impact of climate risks
ClimateWise, a global network of 29 insurance industry organisations which is convened by the University of Cambridge Institute for Sustainability Leadership, has warned of the urgent need to address the growing $100 billion annual climate risk ‘protection gap’ in two new reports; Investing for Resilience and the ClimateWise Principles Independent Review 2016.
The two reports were launched today at a breakfast briefing with over 100 delgates from across the insurance industry including ClimateWise members. Since the 1950s, the frequency of weather-related catastrophes, such as windstorms and floods, has increased six-fold. As climate-related risks occur more often and predictably, previously insurable assets are becoming uninsurable, or those already underinsured further compromised.
The economic impact of these natural catastrophes is growing quickly, with total losses increasing five-fold since the 1980s to around $170bn today. Over the same period, the average annual protection gap has widened quickly from $23bn to $100bn today, according to analysis by ClimateWise member, Swiss Re.
“The insurance industry’s role as society’s risk manager is under threat,” said Maurice Tulloch, Chairman of Global General Insurance at Aviva and Chair of ClimateWise, the network convened by the University of Cambridge Institute for Sustainability Leadership, which authored the reports. “Our sector will struggle to reduce this protection gap if our response is limited to avoiding, rather than managing, society’s exposure to climate risk. As a risk carrier and risk manager, the insurance industry has significant, and as yet untapped, potential to lead others, in reducing this gap.”
ClimateWise’s Investing for Resilience report highlights ways that insurers can start to align their asset management, underwriting and risk management activities to support greater investments in resilience across financial markets. Recommendations include support for green bonds, resilience impact bonds and investments in resilience-enhancing infrastructure.
“The insurance industry will inevitably be impacted by the physical, transition and liability risks that climate change presents,” said John Scott, ClimateWise’s ‘Investing for Resilience’ Chair and Chief Risk Officer, Zurich Global Corporate, Zurich Insurance Group. “Finding viable ways to help society adapt and become more resilient to the inevitable changes related to ongoing climate change is vital.”
The report also calls for the introduction of a resilience rating system to help asset managers and policymakers integrate resilience as a consideration into their investment portfolios.
While traditional responses to rising levels of risk – to re-price, withdraw or transfer exposure to others – will always remain a central feature of the industry’s role as society’s risk manager, ClimateWise believes that closer alignment between the underwriting and asset management sides of the industry must play a greater role in the response to climate change.
“Industry leaders now have the opportunity to step up to the challenge outlined by the Paris Climate Agreement,” Tom Herbstein, Programme Manager of ClimateWise added. “In particular, the industry must help shift capital flows into climate-resilient assets and resilience-enhancing investments rather than simply struggling to maintain its current underwriting exposure.”
Since 2009, ClimateWise members have been benchmarking their response to the protection gap in line with the six ClimateWise Principles. Once again, this year’s submissions are summarised in the ClimateWise Principles Independent Review 2016 reviewed by PwC.
“Climate change presents many risks and opportunities for insurers,” said Jon Williams, Partner, Sustainability & Climate Change at PwC and member of the FSB Task Force on Climate-related Financial Disclosures. “This year’s review highlights clearly that insurers can and need to do more, specifically within their own investment activities, in response to climate-related perils.“
ClimateWise also supports industry innovation via its Societal Resilience Programme. The Programme commissions research into how the insurance industry can better leverage its risk carrying, risk management and investment activities. It explores how, by proactively addressing the protection gap, insurers can benefit by commercialising other parts of their value chain, for example through the provision of advisory services. It focuses on three priority areas, namely regulation, the financial markets and city-level resilience.
Read the reports:
Closing the protection gap: ClimateWise Principles Independent Review 2016
Investing for Resilience
About ClimateWise
Established in 2007, ClimateWise is a growing global network of 29 leading insurers, reinsurers, brokers and industry service providers who share a commitment to reduce the impact of climate change on society and the insurance industry. ClimateWise is a voluntary initiative, driven directly by its members and facilitated by the University of Cambridge Institute for Sustainability Leadership (CISL), which brings business, government and academia together to identify solutions to critical sustainability challenges.
About the University of Cambridge Institute for Sustainability Leadership
The University of Cambridge Institute for Sustainability Leadership (CISL) brings together business, government and academia to find solutions to critical sustainability challenges. CISL provides the secretariat to ClimateWise. Decisions of ClimateWise do not necessarily represent the policies or positions of CISL or of the wider University of Cambridge.
Data taken from Swiss Re sigma. See www.sigma-explorer.com for further information.
A historic year for billion-dollar weather and climate disasters in U.S.
By Adam B. Smith
This blog originally appeared on Climate.gov and is shared with kind permission.
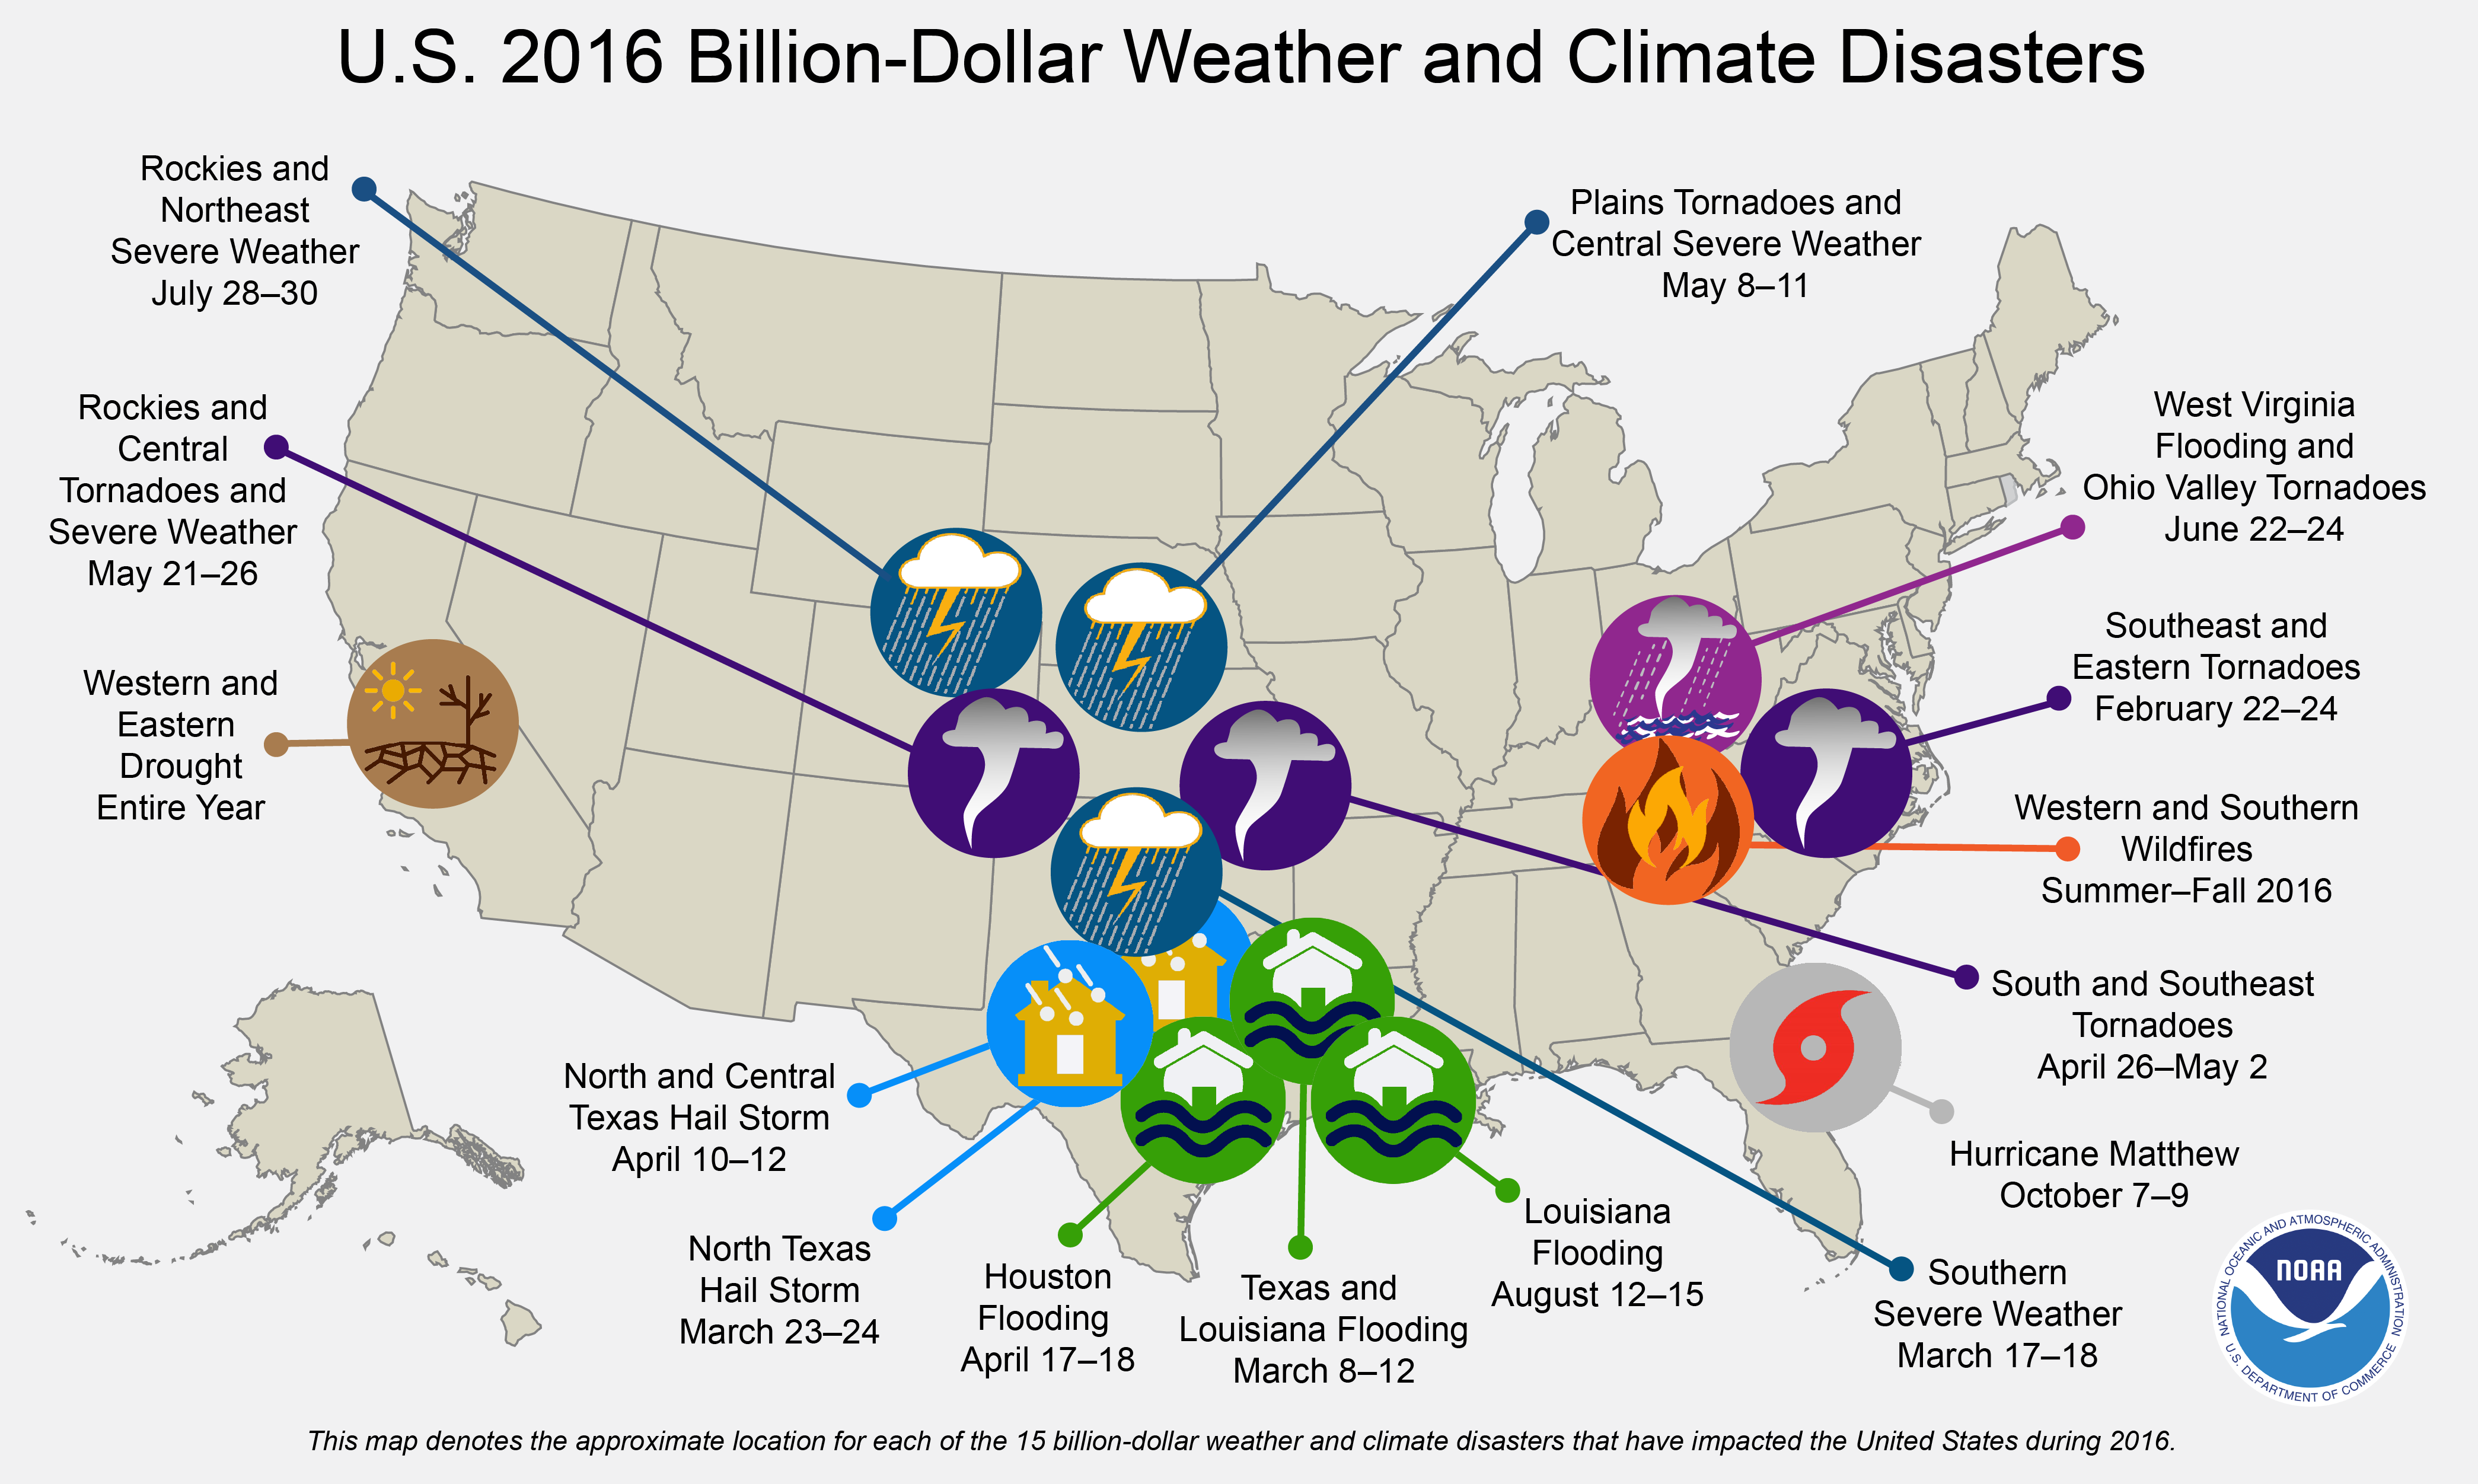
 Image: The location and type of the 15 weather and climate disasters in 2016 with losses exceeding $1 billion dollars. The majority of events occurred in the middle of the country form the Central Plains to Texas and Louisiana. Map by NOAA NCEI, adapted by Climate.gov.
NOAA’s National Centers for Environmental Information (NCEI) tracks U.S. weather and climate events that have great economic and societal impacts (www.ncdc.noaa.gov/billions). Since 1980, the U.S. has sustained 203 weather and climate disasters where the overall damage costs reached or exceeded $1 billion (including adjustments based on the Consumer Price Index, as of January 2017). The cumulative costs for these 203 events exceed $1.1 trillion.
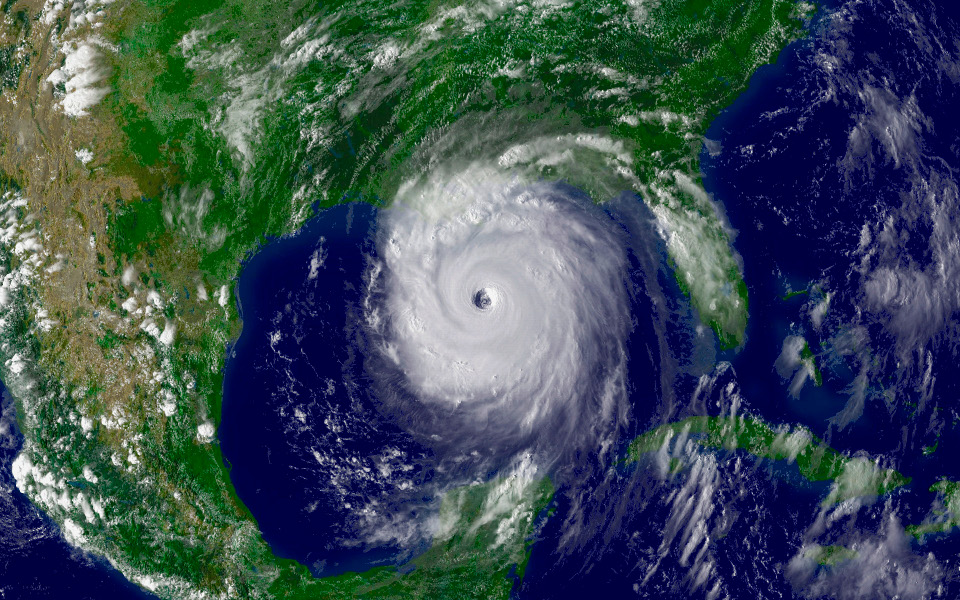
The year 2016 was an unusual year, as there were 15 weather and climate events with losses exceeding $1 billion each across the United States. These events included drought, wildfire, 4 inland flood events, 8 severe storm events, and a tropical cyclone event (see map below). Cumulatively, these 15 events led to 138 fatalities and caused $46.0 billion in total, direct costs. The 2016 total was the 2nd highest annual number of U.S. billion-dollar disasters, behind the 16 events that occurred in 2011.
Perhaps most surprising were the 4 separate billion-dollar inland flood (i.e., non-tropical) events during 2016, doubling the previous record, as no more than 2 billion-dollar inland flood events have occurred in a year since 1980. Three of these flood events were clustered in Louisiana and Texas between March and August, collectively causing damage approaching $15.0 billion. This is a notable record, further highlighted by the numerous other record flooding events that impacted the U.S. in 2016.
The changing frequency of billion-dollar disaster events
The U.S. has experienced a rising number of events that cause significant amounts of damage. From 1980–2016, the annual average number of billion-dollar events is 5.5 (CPI-adjusted). For the most recent 5 years (2012–2016), the annual average is 10.6 events (CPI-adjusted). The year 2005 was the most costly since 1980 due to the combined impacts of Katrina, Rita, Wilma, and Dennis, as shown in the following time-series. The year 2012 was the second most costly due to the extreme U.S. drought ($30 billion) and Sandy ($65 billion) driving the losses.

The increase in population and material wealth over the last several decades are an important factor for the increased damage potential. These trends are further complicated by the fact that many population centers and infrastructure exist in vulnerable areas like coasts and river floodplains, while building codes are often insufficient in reducing damage from extreme events. Climate change is probably also paying a role in the increasing frequency of some types of extreme weather that lead to billion-dollar disasters.
In particular, the U.S. has experienced a higher frequency of billion-dollar inland (i.e., non-tropical) flood events in recent years. Perhaps this should not be unexpected, as heavy rainfall events and the ensuing flood risks are increasing due to the fact that warming loads the atmosphere with more water vapor (NCA, 2014). Over time, a wetter atmosphere increases the potential for extreme rainfall events, which we have experienced more of in recent years (e.g., Colorado, Texas, Louisiana, South Carolina, West Virginia).
Other types of extreme weather events have also shown a higher frequency including the semi-persistent Western drought and wildfire seasons since the year 2000. It has been observed that wildfire seasons are lengthening in the Western states and Alaska (NCA, 2014), while forestry management budgets are increasingly diverted for wildfire suppression costs (USFS, 2015).
In contrast, there have been fewer cold wave / crop-freeze events and destructive winter storm events, which were more frequent in the 1980s and 1990s. It is worth noting that in recent decades, the ratio of broken U.S. record high vs. record low temperatures has been dominated by new record highs, with far fewer record lows (NCAR, 2016; NCEI, 2017). However, trends in winter storm event intensity are subject to more uncertainty than only temperature.
Since 1980, landfalling tropical cyclones have been intermittent but are highly destructive. These impacts will only become more costly, as population and wealth continues to concentrate along our coasts, and sea level continues to rise. Severe local storm impacts (i.e., tornado, hail, straight-line winds) have risen in recent years but long-term trends in these events are subject to greater uncertainties (Tippet et al., 2016).
The frequency of disaster events by type
The distribution of damage from U.S. Billion-dollar disaster events across the 1980-2016 period of record (as of January 2017, CPI-adjusted) is dominated by tropical cyclone losses. The following table highlights that landfalling tropical cyclones have caused the most damage ($560.1 billion) and have the highest average event cost ($16.0 billion per event).
Drought ($223.8 billion), severe storms ($180.1 billion) and inland flooding ($110.7 billion) have also caused considerable damage based on the list of billion-dollar events. It is of note that severe storms are responsible for the highest number of billion-dollar disaster events (83) yet the average event cost is the lowest ($2.2 billion)— but still substantial. Tropical cyclones and flooding represent the second and third most frequent event types (35 and 26), respectively.

The spatial distribution of disaster events by type
The U.S. is weather and climate conscious for good reason, as each geographic region faces a unique combination of persistent hazards. The maps below reflect the frequency with which each state has been part of a billion-dollar disaster event (i.e., the totals do not mean that each state alone suffered $1 billion in losses for each event).

Each disaster type has a distinct footprint of impact over time. We see wildfire impacts largely west of the Plains states, including a few Southeast impacts. The high-frequency inland flooding events often occur in states adjacent to large rivers or the Gulf of Mexico, which is a warm source of moisture to fuel rainstorms. Drought impacts are most focused in the Southern and Plains states where there are billions of dollars in agriculture and livestock assets.
Severe local storm events are common in the Plains and into the Ohio River Valley states. Winter storm impacts are concentrated in the Northeast, not surprising given the propensity for Nor’easters, while tropical cyclone impacts range from Texas to New England, but also include many inland states.
In total, from 1980–2016, the U.S. South/Central and Southeast regions experienced a higher frequency of billion-dollar disaster events than any other region, as shown in the red total disaster map. This map reflects the cumulative diversity, frequency, & severity of weather & climate events impacting these regions.

More technical background on the methodology, data sources, and caveats
The U.S. Billion-dollar disaster reports assess the total, direct losses from numerous weather and climate disasters including: tropical cyclones, floods, drought & heat waves, severe local storms (i.e., tornado, hail, straight-line wind damage), wildfires, crop freeze events, and winter storms.
These loss estimates reflect direct effects of weather and climate events (i.e., not including indirect effects such as subsequent loss of tourism or missed work by employees) and constitute total losses (i.e., both insured and uninsured). The insured and uninsured direct loss components include: physical damage to residential, commercial and government/municipal buildings, material assets within a building, time element losses (i.e., businesses interruption), vehicles, boats, offshore energy platforms, public infrastructure (i.e., roads, bridges, buildings) and agricultural assets (i.e., crops, livestock, timber).
These loss assessments do not take into account losses to natural capital/assets, healthcare related losses, or values associated with loss of life. Only weather and climate disasters which cause losses of ≥ 1 billion-dollars in calculated damage including Consumer Price Index (CPI) inflation adjustment are included in this dataset. The following table provides an overview of the metadata behind the data sources used in the U.S. billion-dollar event analysis.
These natural disaster cost assessments require input from a variety of public and private data sources including the Insurance Services Office (ISO) Property Claim Services (PCS), Federal Emergency Management Agency (FEMA) National Flood Insurance Program (NFIP) and Presidential Disaster Declaration (PDD) assistance, and the United States Department of Agriculture (USDA) National Agricultural Statistics Service (NASS) & Risk Management Agency (RMA), among others.

_______________________
Published research on report data sources, methodology, potential bias, and uncertainty modeling
Smith A.B. and J. Matthews, 2015: Quantifying Uncertainty and Variable Sensitivity within the U.S. Billion-dollar Weather and Climate Disaster Cost Estimates. Natural Hazards, 77, 1829-1851
Smith A.B. and R. Katz, 2013: U.S. Billion-dollar weather and climate disasters: Data sources, trends, accuracy and biases. Natural Hazards, 67, 387–410
Additional cited references
NCA, 2014: http://nca2014.globalchange.gov/report
NCAR, 2016: https://www2.ucar.edu/atmosnews/news/124082/days-record-breaking-heat-ahead
NCEI, 2017: https://www.ncdc.noaa.gov/cdo-web/datatools/records
Tippet et al., 2016: http://science.sciencemag.org/content/early/2016/11/30/science.aah7393.full
U.S. Forest Service, 2015: https://www.fs.fed.us/about-agency/budget-performance/cost-fire-operations
"Challenge Trump climate denial" UK scientists urge UK Prime Minister May
One hundred leading UK climate research scientists have called on the UK Prime Minister Theresa May to press US President-Elect Donald Trump to accept the realities and risks of climate change.
In a letter to the UK Prime Minister, the scientists call on her to use the United Kingdom’s ‘special relationship’ with the US to persuade Mr Trump: “to acknowledge the scientific evidence about the risks of climate change, to continue to support international action to counter climate change, and to maintain support for world class research and data-gathering on climate change in the United States.”
The full text of the letter follows with the list of supporting scientists:
13 January 2017
Dear Prime Minister,
We are writing as members of the climate change research community in the United Kingdom to alert you to what we see as potential threats to, and opportunities for, the national interest arising from the recent elections in the United States of America.
President-Elect Trump has indicated on many occasions, including since his election on 8 November 2016, that he does not fully accept the scientific evidence about the risks of climate change caused by human activities. Several of the individuals nominated for key posts in the President-Elect’s administration, such as the head of the Environmental Protection Agency, have made public statements rejecting the evidence for climate change risks. In doing so, the President-Elect and his nominated appointees are disregarding the findings and advice of the leading expert bodies around the world, including the Intergovernmental Panel on Climate Change and the United States National Academy of Sciences.
Furthermore, there have been worrying media reports that the incoming administration may severely weaken climate change research and data-gathering undertaken by federal organisations in the United States. This would diminish the provision of robust and rigorous evidence that is used by policy-makers and researchers around the world, including in the United Kingdom.
We believe that the United Kingdom must be prepared to respond decisively to these developments. The United Kingdom has been at the forefront of international climate change research and evidence- based policy-making for more than 30 years. Margaret Thatcher was the first world leader to publicly acknowledge the risks of climate change in 1988, and established the Hadley Centre at the Met Office, now internationally renowned for its climate change research.
For many years, climate change researchers in the United States and United Kingdom have worked extensively with each other and with researchers from across the world. We stand ready to support and assist our counterparts in the United States, as collaborators, co-authors and colleagues, in resisting any political attempts to prevent, hamper or interfere with vital research on climate change.
We urge you, as Prime Minister, to use the United Kingdom’s special relationship with the United States, as well as international fora such as the G7 and G20, to press President-Elect Trump and his administration to acknowledge the scientific evidence about the risks of climate change, to continue to support international action to counter climate change, including the Paris Agreement, and to maintain support for world class research and data-gathering on climate change in the United States.
Effective management of the risks of climate change requires all countries to be fully engaged in understanding both their complexities and the options for responding to them. We believe that the United Kingdom could now have a great opportunity to work alongside the United States in strengthening the evidence base, supporting the development of innovative technologies, and leading international cooperation to manage the risks of climate change. We are signing as individuals, rather than as representatives of our employers, but we list our affiliations as evidence of our membership of the climate change research community.
Yours sincerely (in alphabetical order),
Dr. George Adamson (Lecturer in Geography, King’s College London)
Professor Richard Allan (Meteorology Department Head for External Affairs, University of Reading)
Professor Myles R. Allen FInstP (Professor of Geosystem Science, Environmental Change Institute, University of Oxford)
Professor Chris Armstrong (Professor of Political Theory and Head of the Department of Politics and International Relations, University of Southampton)
Professor Nigel Arnell FRGS FRMetS (Professor of Climate System Science, University of Reading) Dr. Scott Archer-Nicholls (Postdoctoral Research Associate, Centre for Atmospheric Science, Department of Chemistry, University of Cambridge)
Professor John Barrett (Director of the Centre for Industrial Energy, Materials and Products, School of Earth and Environment, University of Leeds)
Professor Paul Bates (Head, School of Geographical Sciences, University of Bristol)
Dr. Stephanie Bates (Research technician in isotope biogeochemistry, School of Earth Sciences, University of Bristol)
Dr. Emma Boland (Physical Oceanographer, British Antarctic Survey)
Dr. Michelle Cain (Post-doctoral Researcher, University of Cambridge)
Professor Andy Challinor (Professor of Climate Impacts, University of Leeds)
Professor Mat Collins FRMetS (Exeter Climate Systems, University of Exeter)
Professor Peter Convey (Deputy Leader, Biodiversity, Evolution and Adaptation Team, British Antarctic Survey)
Professor Declan Conway (Professorial Research Fellow, Grantham Research Institute on Climate Change and the Environment, London School of Economics and Political Science)
Professor Rosalind Cornforth FRMetS (Director, Walker Institute, University of Reading)
Dr. Kevin Cowtan (Research Fellow, University of York)
Professor Peter Cox (Professor of Climate System Dynamics, University of Exeter)
Dr. Elizabeth Cripps (Senior Lecturer in Political Theory, University of Edinburgh)
Dr. Emma Cross (Research Associate, University of Cambridge and British Antarctic Survey)
Professor Richard Dawson (Director of the Centre for Earth Systems Engineering Research, Newcastle University)
Professor Simon Dietz (Co-Director, ESRC Centre for Climate Change Economics and Policy, London School of Economics and Political Science)
Professor Paul Ekins OBE FEI (Director, Institute for Sustainable Resources, University College London)
Dr. Robert Falkner (Associate Professor of International Relations, London School of Economics and Political Science)
Professor Sam Fankhauser (Co-Director, Grantham Research Institute on Climate Change and the Environment, London School of Economics and Political Science)
Professor Piers Forster FRMetS (Director, Priestley International Centre for Climate, University of Leeds)
Professor Eric S. Fraga CPSE (Chemical Engineering, University College London)
Professor Pierre Friedlingstein (Chair, Exeter Climate Systems, University of Exeter)
Professor Hayley Fowler (Professor of Climate Change Impacts, School of Civil Engineering and Geosciences, Newcastle University)
Professor Timothy J. Foxon (Professor of Sustainability Transitions, Science Policy Research Unit, University of Sussex)
Professor Alberto C. Naveira Garabato (National Oceanography Centre, University of Southampton)
Alyssa Gilbert (Director of Policy and Translation, Grantham Institute – Climate Change and the Environment, Imperial College London)
Dr Marisa Goulden (Lecturer in Climate Change, University of East Anglia and Tyndall Centre for Climate Change Research),
Professor Andrew Gouldson (Deputy Director, ESRC Centre for Climate Change economics and Policy, University of Leeds)
Professor Dabo Guan (Director of Water Security Research Centre, University of East Anglia)
Professor Joanna Haigh CBE FRS (Co-Director Grantham Institute – Climate Change and the Environment, Imperial College London)
Professor Sir Andy Haines (Departments of Social and Environmental Health Research and of Population Health, London School of Hygiene and Tropical Medicine)
Professor Jim Hall FREng (Director of the Environmental Change Institute, University of Oxford)
Professor Jason Hall-Spencer (Professor of Marine Biology, University of Plymouth)
Professor Neil Harris (Co-chair of WCRP/SPARC Centre for Atmospheric Informatics and Emissions Technology, Cranfield University)
Professor Gideon Henderson FRS (Head of Department, Earth Sciences, University of Oxford)
Dr. Sian Henley (NERC Independent Research Fellow, School of Geosciences, University of Edinburgh)
Dr. Scott Hosking (Climate Scientist, British Antarctic Survey)
Dr. Jo House (Cabot Institute, School of Geographical Sciences, University of Bristol)
Dr Keith Hyams (Associate Professor, University of Warwick)
Dr. Helen L. Johnson (Associate Professor in Climate and Ocean Modelling, Department of Earth Sciences, University of Oxford)
Dr. Dan Jones (Physical Oceanographer, British Antarctic Survey)
Professor Phil Jones FRMetS (Professorial Fellow, Climatic Research Unit, School of Environmental Sciences, University of East Anglia)
Dr. Joakim Kjellsson (Postdoctoral Research Assistant, Atmospheric, Oceanic & Planetary Physics, University of Oxford) Professor Christine S. Lane (Professor of Geography (1993), University of Cambridge)
Professor Alice Larkin FInstP (Director of Tyndall Manchester, Tyndall Centre for Climate Change Research, University of Manchester)
Professor Corinne Le Quéré FRS (Professor of Climate Change Science and Policy at the University of East Anglia and Director of the Tyndall Centre for Climate Change Research)
Professor Simon Lewis (University College London)
Professor Dan Lunt (Professor of Climate Science, University of Bristol)
Dr Niall Mac Dowell (Clean Fossil and Bioenergy Research Group and Lecturer in Energy and Environmental Technology and Policy, Imperial College London)
Professor Catriona McKinnon (Director, Leverhulme Programme in Climate Justice, University of Reading)
Professor Mark Maslin FRGS FRSA (Director, London NERC Doctoral Training Partnership, University College London)
Dr. Elaine Mawbey (Postdoctoral Research Assistant, School of Earth Sciences, University of Bristol)
Dr Dann Mitchell (Lecturer in Climate Change, University of Bristol)
Professor Hugh Montgomery FRCP FRGS FRSB FRI FFICM, Professor of Intensive Care Medicine, University College London)
Dr. Twila Moon (Lecturer in Cryospheric Sciences, Bristol Glaciology Centre, School of Geographical Sciences, University or Bristol)
Professor Stephen de Mora CChem FRSC FRSB FRSA (Chief Executive, Plymouth Marine Laboratory)
Professor Richard Morris (Professor in Medical Statistics, University of Bristol)
Professor Andy Morse FRMetS FRGS (Professor of Climate Impacts, University of Liverpool)
Professor David Newbery FBA CBE (Director, Cambridge Energy Policy Research Group),
Professor Dan Osborn (Chair of Human Ecology, Department of Earth Sciences, University College London)
Professor Timothy Osborn (Director of Research, Climatic Research Unit, School of Environmental Sciences, University of East Anglia)
Professor Jouni Paavola (Co-Director of the ESRC Centre for Climate Change Economics and Policy, School of Earth and Environment, University of Leeds)
Professor Tim Palmer CBE FRS (Royal Society Research Professor, Department of Physics, University of Oxford)
Professor Richard Pancost (Professor of Biogeochemistry and Director of the Cabot Institute, University of Bristol)
Professor Martin Parry OBE (Centre for Environmental Policy, Imperial College London)
Professor Paul N. Pearson (School of Earth and Ocean Sciences, Cardiff University)
Professor Arthur Petersen (Professor of Science, Technology and Public Policy, University College London)
Professor Nicholas Pidgeon MBE (Professor of Environmental Risk, Cardiff University)
Professor Raymond Pierrehumbert (Halley Professor of Physics, University of Oxford)
Dr. Jeff Price (Senior Researcher, Tyndall Centre for Climate Change Research, University of East Anglia)
Professor Chris Rapley CBE (Professor of Climate Science, University College London)
Dr. Tim Rayner (Research Fellow, Tyndall Centre for Climate Change Research, University of East Anglia)
Professor Dave Reay (Assistant Principal, University of Edinburgh)
Professor Rosalind Rickaby (Professor in Biogoechemistry, Associate Head of Department for Research, Department of Earth Sciences, University of Oxford)
Dr. Maria Russo (Research Scientist, National Centre for Atmospheric Science/Cambridge Centre for Climate Science, University of Cambridge)
Professor Daniela Schmidt FRSB (School of Earth Sciences, Cabot Institute, University of Bristol)
Professor Andrea Sella (Department of Chemistry, University College London)
Professor Ted Shepherd FRS (Grantham Professor of Climate Science, University of Reading)
Professor Keith P. Shine FRS (Regius Professor of Meteorology and Climate Science, University of Reading)
Dr. Emily Shuckburgh FRMetS OBE (Deputy-Head of Polar Oceans, British Antarctic Survey)
Professor Henry Shue (Senior Research Fellow, Centre for International Studies, University of Oxford)
Professor Martin Siegert FRSE (Co-Director, Grantham Institute – Climate Change and the Environment, Imperial College London)
Dr. Thomas Smith (Lecturer in Physical & Environmental Geography, Kings College London)
Dr. David Stainforth (Associate Professorial Research Fellow, Grantham Research Institute on Climate Change and the Environment, London School of Economics and Political Science)
Dr. Julia K. Steinberger (Associate Professor in Ecological Economics, School of Earth and Environment, University of Leeds)
Professor Lindsay C. Stringer (Professor in Environment and Development, University of Leeds)
Professor Phil Taylor (Director, National Centre for Energy Systems Integration)
Dr. Carol Turley OBE (Senior NERC Knowledge Exchange Open Fellow, Plymouth Marine Laboratory)
Professor Paul Valdes (Director, NERC Great Western Four+ Doctoral Training Partnership, University of Bristol).
Bob Ward FGS FRGS (Policy and Communications Director, Grantham Research Institute on Climate Change and the Environment, London School of Economics and Political Science),
Professor Rachel Warren (Professor of Global Change and Environmental Biology, Tyndall Climate Change Centre, University of East Anglia)
Professor Jim Watson (Director, UK Energy Research Centre)
Professor Lorraine Whitmarsh (School of Psychology and Tyndall Centre for Climate Change Research, Cardiff University)
Dr. Phillip Williamson (Associate Fellow, University of East Anglia)