
In the latest demonstration of institutional asset owners’ commitment to climate action, New York State Common Retirement Fund (CRF), the third largest public pension fund in the US with $184.5 billion in assets, has joined the Portfolio Decarbonization Coalition (PDC).
The CRF is the first major US pension fund to join the Coalition’s 28 members, who between them control over $3 trillion in assets and have pledged to gradually decarbonize a total of $600 billion by designing investment portfolios with a smaller climate change impact.
One year ago, New York State Comptroller Thomas P. DiNapoli, trustee of the CRF, announced plans at the Paris climate talks to position the Fund for a low carbon future. In partnership with Goldman Sachs, the CRF developed a low emission index, which steers assets away from large carbon emitters and increases investments in carbon-efficient companies.
“Climate change is one of the greatest risks to our pension fund’s portfolio,” DiNapoli said. “We’re reviewing and adjusting our investments to reduce that risk and take advantage of the growing opportunities of a lower carbon future. Investors are playing a key role in fostering a cleaner global economy. The PDC gives us the opportunity not only to highlight our own activities in this regard, but also to share insights and challenges with counterparts around the world.”
“Investments with more carbon translate to higher risk, not just from potential carbon fees or pricing, but also from shifts in technology that can leave high carbon assets stranded,” said Erik Solheim, Head of UN Environment. UN Environment’s Finance Initiative is a co-founder of the PDC.
“The success of the Portfolio Decarbonization Coalition is a clear signal to both governments and companies that climate change, and the corporate response to it, is critical to shareholder value and investor interests going forward,” said Solheim.
CRF’s action comes at a time of intense efforts by the financial community to prevent market shocks from the widespread mispricing of climate change risks.
Last month, the G20’s Task Force on Climate-related Financial Disclosures co-chaired by former New York Mayor Michael Bloomberg and Bank of England Governor Mark Carney recommended full and standardized disclosure by companies and investors of financial risks and opportunities from climate change.
Other investor members of the PDC include major European funds such as France’s ERAFP ($26.9 billion) and FRR ($38.5 billion), the Dutch giant ABP ($481.1 billion) and the world’s largest insurance company, Germany’s Allianz Group.
“We are seeing significant international collaboration among leading asset owners to push on climate issues,” said Lance Pierce, President of CDP North America, the international not-for-profit organization holding the world’s largest collection of self-disclosed corporate environmental data and one of the Portfolio Decarbonization Coalition organizers.
Pierce added, “Climate change is requiring transformational changes in the economy in order to safeguard assets and supply chains, and presents a significant economic growth opportunity. The US renewable energy sector employed 769,000 people and the solar industry grew 12 times faster than overall job creation in 2015. Investors are realizing they can reduce carbon, reduce risk and generate steady financial returns as well as jobs.”
About New York State Common Retirement Fund’s sustainability investing
DiNapoli has positioned the Fund in the vanguard of institutional investors who seek out and promote sustainable investing that takes environmental, social and corporate governance considerations into account as part of their long-term strategy. The Fund is committed to the belief that well-managed businesses, which focus on the long-term health of the company and work to avoid environmental damage or harm to the communities in which they operate, are more likely to produce sound returns. A growing body of academic research confirms this and investment firms that integrate sustainability in their decisions have performed well for the Fund.
About CDP
CDP, formerly Carbon Disclosure Project, is an international, not-for-profit organization providing the largest global system for companies and cities to disclose and manage vital information concerning climate change, water and forest risk commodities information. Backed by 830 institutional investors with assets of US$100 trillion, CDP puts these insights at the heart of strategic business, investment and policy decisions. More than 5,800 companies disclosed environmental information through CDP in 2016. Please follow us @CDP to find out more.
About the Portfolio Decarbonization Coalition
The Portfolio Decarbonization Coalition was co-founded by CDP, the UN Environment Finance Initiative, The Fourth Swedish National Pension Fund (AP4) with assets of $34 billion, and Amundi, Europe’s largest asset manager with more than $1.07 trillion in assets. In the 15-month lead-up to the December 2015 Paris climate talks the Coalition received $600 billion in commitments from investors of capital positioned towards a low-carbon economy, six times more than its $100 billion goal. For more information, please visit: www.unepfi.org/pdc
About UNEP FI
The UNEP Finance Initiative (UNEP FI) is a unique partnership between UNEP and a global network of over 200 banks, insurers and investors from 51 countries.
Created in the wake of the 1992 Earth Summit UNEP FI’s mission is to mainstream the integration of sustainability across the finance sector. It provides a neutral space to convene stakeholders and acts as a platform at the intersection between finance, science and policy. Please visit www.unepfi.org, for more information.
Source: CDP
BlackRock – Adapting portfolios to climate change
Investors can no longer ignore climate change. Some may question the science, but all are faced with a swelling tide of climate-related regulations and technological disruption. We show how to mitigate climate risks, exploit opportunities or have a positive impact.
Key highlights
- We detail how climate change presents risks and opportunities through four channels: 1) physical: more frequent and severe weather events; 2) technological: advances in batteries, electric vehicles or energy efficiency; 3) regulatory: subsidies, taxes and energy efficiency rules, and; 4) social: changing consumer and corporate preferences.
- The longer an asset owner’s time horizon, the more climate-related risks compound. Yet even short-term investors can be affected by regulatory and policy developments, technological disruption or an extreme weather event.
- We show how all asset owners can — and should — take advantage of a growing array of climate-related investment tools and strategies to manage risk, search for excess returns or improve their market exposure.
- We detail what many see as the most cost-effective way for governments to meet emissions-reduction targets: policy frameworks that result in realistic carbon pricing. These would incentivise companies to innovate and help investors quantify climate factors. We see them as a scenario investors should prepare for.
Warming paths
Scenarios for global temperatures, 2010-2100

The speed of the energy transition is key to assessing climate risks and opportunities. Most countries have submitted plans to reduce carbon emissions in so-called intended nationally determined contributions (INDCs). The aim is to limit global warming to less than two degrees Celsius (2°C) above pre-industrial levels – the threshold where many scientists see irreversible damage and extreme weather effects kicking in.
Yet the INDCs are just a first step, as the chart above shows. No action at all or current policies would lock in much more severe warming. Slow action would mitigate regulatory risk in the short run, but raise the possibility of extreme weather events. These events, in turn, could prompt more drastic policy actions down the road. The bolder the policy action taken today, by contrast, the greater the ‘transition risk’ for industries and assets due to fast technological and other changes.
Yet the INDCs are just a first step, as the chart above shows. No action at all or current policies would lock in much more severe warming. Slow action would mitigate regulatory risk in the short run, but raise the possibility of extreme weather events. These events, in turn, could prompt more drastic policy actions down the road. The bolder the policy action taken today, by contrast, the greater the ‘transition risk’ for industries and assets due to fast technological and other changes.
DOWNLOAD FULL REPORT
Spurce: BlackRock Investment Institute
Spurce: BlackRock Investment Institute
New report provides authoritative scientific assessment of climate change risks to UK
Climate change is happening now. Globally, 14 of the 15 hottest years on record have occurred since 2000.
The impacts of climate change are already being felt in the UK, and urgent action is required to address climate-related risks, the CCC’s Adaptation Sub-Committee (ASC) says today.
The ASC’s new independent report to Government, ‘UK Climate Change Risk Assessment Evidence Report’ sets out the most urgent risks and opportunities arising for the UK from climate change.
The report is the result of more than three years of work involving hundreds of leading scientists and experts from the public and private sectors and civil society. The risk assessment has been peer reviewed by UK and international specialists.
Changes to the UK climate are likely to include periods of too much or too little water, increasing average and extreme temperatures, and sea level rise. The report concludes that the most urgent risks for the UK resulting from these changes are:
- Flooding and coastal change risks to communities, businesses and infrastructure.
- Risks to health, wellbeing and productivity from high temperatures
- Risk of shortages in the public water supply, and water for agriculture, energy generation and industry, with impacts on freshwater ecology.
- Risks to natural capital, including terrestrial, coastal, marine and freshwater ecosystems, soils and biodiversity.
- Risks to domestic and international food production and trade.
- Risks of new and emerging pests and diseases, and invasive non-native species, affecting people, plants and animals.
The opportunities for the UK from climate change include:
- UK agriculture and forestry may be able to increase production with warmer weather and longer growing seasons, if constraints such as water availability and soil fertility are managed.
- There may be economic opportunities for UK businesses from an increase in global demand for adaptation-related goods and services, such as engineering and insurance.
The impact of the recent vote to leave the European Union does not change the overall conclusions of the risk assessment. However, some individual risks may change if EU-derived policies and legislation are withdrawn and not replaced by equivalent or better UK measures. The Adaptation Sub-Committee will assess the implications of the EU referendum in its next statutory report to Parliament on the UK National Adaptation Programme, due to be published in June 2017.
Lord Krebs, Chairman of the Adaptation Sub-Committee of the Committee on Climate Change, said: “The impacts of climate change are becoming ever clearer, both in the United Kingdom and around the world. We must take action now to prepare for the further, inevitable changes we can expect. Our independent assessment today, supported by the work of hundreds of scientists and other experts, identifies the most urgent climate change risks and opportunities which need to be addressed. Delaying or failing to take appropriate steps will increase the costs and risks for all UK nations arising from the changing climate.”
Notes to editors
- The Climate Change Act requires the UK Government to compile every five years its assessment of the risks and opportunities arising for the UK from climate change, known as the Climate Change Risk Assessment (CCRA). The ASC’s Evidence Report published today will inform the Government’s second Climate Change Risk Assessment due to be presented to Parliament in January 2017. The first CCRA was presented to Parliament by Government in 2012.
- The Climate Change Act places a duty on the Adaptation Sub-Committee to provide independent advice six months in advance of the Government’s Climate Change Risk Assessment report to Parliament being due. The Evidence Report, consisting of eight individual chapters looking at key areas of risk and opportunity, constitutes the ASC’s advice on the Government’s second CCRA. Each chapter has been written by expert lead authors supported by co-authors with particular specialties. The individual chapters are the product of their expert authors. A Synthesis Report has also been produced by the ASC to highlight the key messages of the Evidence Report.
- The Synthesis Report ‘UK Climate Change Risk Assessment: priorities for the next five years’, together with the chapters of the full Evidence Report, and associated materials is available here.
Yorkshire: Report on economic impact of 2015 floods
The unprecedented floods of Boxing Day 2015 had a serious impact on the borough of
Calderdale, and the Upper Calder Valley was particularly badly hit.
Small and medium sizedbusinesses (SMEs), which make up the majority of the local businesses in the economy, were worst affected. Understanding the situation of SMEs is important, as they represent key drivers in achieving the growth and development needed for economic recovery.
This report presents an economic impact assessment of the flooding on SMEs. This study will support the evidence that the Calderdale Flood Commission collates to make recommendations to Government, the Council, the Environment Agency, the community and businesses, about the effects of recent flooding and lessons for possible future flooding. This report will assist policy makers and local stakeholders to take effective action based on what the community of SMEs needs to recover and continue to provide jobs, products and servicefor local communities.
Background
The Calder Valley has a long history of flooding, but the regularity and scale of
flooding appears to have increased since 2000. In 2012, a month’s worth of rain fell in
less than 24 hours, affecting numerous businesses and households.
On Boxing Day 2015 even higher levels of water were recorded, which deluged a
much wider range of properties from Todmorden to Brighouse along the River Calder.
Over 2,800 houses and 1600 business premises were affected by the flooding
Calderdale Council’s Business & Skills team has been administering the package of
Flood Recovery grants for businesses, and has processed almost 900 applications.
The sector most severely affected by the December 2015 flooding is retail, especially
in Hebden Bridge, Mytholmroyd/Luddendenfoot and Todmorden.
As of 31 March 2016, around 83% of flood affected businesses were back in
operation across Calderdale, but the picture is not consistent. Just 61% of Hebden
Bridge businesses are open.
Initial scoping by Upper Calder Valley Renaissance (UCVR)
Immediately after the flooding, the ‘UCVR Business Flood Recovery Team’ was
formed to assess the initial extent of the impact. They conducted a basic online
survey.
150 businesses in total responded to this initial survey, including those located in
Sowerby Bridge and Luddenden/Luddendenfoot.
The data obtained by the survey was useful to Calderdale Council to assist in their bid
for emergency funding from central government. It also helped identify businesses in
need of support, as well as contact details of affected businesses.
Economic impact assessment
The University of Leeds, in conjunction with the Council’s Business team and UCVR,
conducted an economic impact assessment of the floods on SMEs.
The data was collected via an online questionnaire administered to businesses in the
borough of Calderdale.
The majority of the respondents are business owners (~80%) and around six in every
ten firms have less than 5 employees.
Half of the sampled businesses have been operating for less than 10 years and
approximately 60% rent their premises.
Almost three quarters of the sampled businesses were in operation at the time of the
2012 floods.
The estimated value of the overall costs to the business during the 2012 floods was
£26,000, and half of the businesses reported having losses for £5,000 or less.
The greater intensity of the 2015 floods, compared to those of 2012, translated into
higher costs. The 2015 flooding was 1.3 times more damaging to businesses, while
the total losses suffered by SMEs almost doubled.
Hebden Bridge reported the largest number of cases. However, Mytholmroyd suffered
the highest losses per SME.
The total amount of losses reported by the surveyed businesses is almost £47 million,
which represents around 12% of their annual turnover. Excluding a small amount of
enterprises that reported total losses above £500,000, the average loss per firm was
around £47,000.
The total reported losses (£47 million) account for 5.4% of the business sector GVA in
Calderdale and Kirklees.
The amount of losses were almost twice as high for businesses with less than 4
employees than for businesses with more than 20 employees.
On average, businesses with less than 4 employees have recovered 45% of their
sales, in comparison to 66% by larger businesses.
The surveyed firms are considering laying off a total of 124 employees in the next 3
months, which would represent a loss of around £2.3 million or 1.8% of their annual
wage bill.
The total amount of lost sales amounted to nearly £7 million at the time the survey
was conducted. The sector worst hit worst is Retail and Wholesale, followed by
Manufacturing.
When taking into account direct and indirect losses, the total economic impact to the
Calderdale and Kirklees regional economy amounts to a total of approximately £170
million. This figure represents 1.1% of the total output of the region (Office of National
Statistics – ONS). For every £1 reported in direct losses, another £0.6 on average was
lost indirectly throughout the regional economy.
Three out of five businesses have recovered 50% of their normal sales. On average it
has taken almost twice the time for firms to recover their monthly average sales,
compared to the 2012 floods.
Three out of five of the surveyed businesses have at least one type of insurance.
Nevertheless, around 14% had an insurance excess that was so high it has not been
worth submitting a claim.
70% of the surveyed forms mentioned they have received grant aid from local or
central government, followed by business rebate (43%) and advice from Council or
business support organisations (42%).
Almost half of surveyed businesses do not set aside time for planning for flooding,
and less than a quarter monitor free flood warning systems.
Rabobank – Asia-Pacific: agricultural perspectives
- The Asia region is a decisive component in the global food chain, accounting for 19% of total global food and agriculture exports and 31% of total food and agriculture imports
- Asia’s large and growing population, coupled with rising incomes and a burgeoning middle class, will continue to drive demand for food & agricultural commodities and resources
- On the other hand, Asia cannot produce enough to support itself. Limited arable land, inadequate water and poor resource management, low farm yields, environmental and soil degradation and infrastructure inadequacy are limiting production. Consequently, Asia and especially China’s need for imports and investment locally and abroad is likely to increase
- Asia agribusiness and food & agriculture companies are likely to grow in size and scope to meet the increasing demand, national policies, rising organisational capabilities, and integration and consolidation throughout the value and supply chains
Authors: Ping Chew and Marc Soccio
Asia’s position in the global food market tilts heavily towards demand due to its huge population and limited agricultural resources. With only one-fifth of the world’s agricultural land, the region hosts more than half of the global population. Asia has achieved significant production improvements over the last 50 years but produces lower yields compared to most other regions, with depleting resources including water, deteriorating soil quality, inadequate logistics and inefficient farming practices and land usage. These issues are beginning to be challenged and addressed through market-oriented approaches and corporate farming to satisfy a growing population featuring rising income levels, urbanisation, demand for higher food quality and environmental concerns.
Asia, a consumption magnet
Whilst North America and Europe are likely to see negligible population growth, Asia’s population is expected to increase from 4.3 billion in 2015 to 5.1 billion by 2050. Specifically, Asia’s two giant economies – the People’s Republic of China and India – are already enormous players within the global food system. For example, China and India together account for 28% of world cereal consumption and nearly 40% of palm oil consumption. China alone accounts for 25% and 27% respectively of world soy and meat consumption. Asia’s importance for food markets is becoming amplified by higher economic growth in Asian economies, which will have an impact on both the composition and the level of food consumption. Emerging Asia’s total GDP (including India and China but excluding Japan) nearly equalled the European Union’s (EU) GDP in 2015 and is predicted to overtake the EU in 2016. Over the next five years, the IMF is forecasting that emerging Asia’s GDP will grow by about 6.5% per year compared to 2.5% and 1.9% respectively for the US and the EU.
 Source: FAO
… but the consumption pattern is in transition …
As often observed, during the initial stages of economic growth an improvement in average income leads to an increase in cereal consumption. However as income continues to rise, food consumption gradually shifts from staples to protein and other high value food items like dairy and fruit and vegetables. With economic prosperity likely to continue to improve in the region, we can expect dramatic shifts in both the shape and the composition of the Asian food basket. China is a prime example of this shift in consumption habits. As average income started to improve in the early 1980s for Chinese consumers, consumption of cereals increased. However since the late 1990s the shift to protein foods and fruit & vegetables has become more pronounced. Nowhere is this phenomenon more apparent than in China’s position in the global pork industry, where it produces 49% of global production and accounts for 52% of global consumption [2014]. In emerging Asia as a whole, between 1991 and 2011, the share of fruit, vegetables, meat and fish in the consumption basket grew faster than the share of staple foods. Total demand for grains is on the rise, as the increasing share of meat intake is leading to strong growth in demand for animal feed.
Furthermore, as the modern trade share of overall groceries increases, consumption will shift from unprocessed and unbranded to branded and packaged food. This presents an interesting dichotomy in that whilst overall cereal consumption growth in Asia will mirror steady growth in population, the branded cereals category may continue to see robust growth for several years. For instance, whilst overall rice consumption in India per capita is lagging population growth, the organised, branded rice market is growing at 15% per annum.
… as Asian consumer aspiration adapts to an improving economic position
 Source: FAOSTAT, Rabobank Analysis
Consumer behaviour and aspiration in Asia is also becoming directly influenced by rapid economic growth and the growth of the middle class population. This emerging Asian consumer is characterised by adoption of a western lifestyle, a high level of familiarity with the latest consumer technology and increased awareness of health and wellness issues and brand consciousness. This is exhibited nowhere more clearly than in China, which has seen the emergence of a new, young middle class with attitudes and aspiration akin to western consumers. Other countries in the region are no exception to this pattern, with the trend towards westernisation and modernisation of lifestyles. Therefore, as the rest of Asia develops further, it will follow the route taken by China and South Korea, with a consequent impact on consumption and purchasing behaviour.
Asia is a production giant as well, just not big enough
Global production rankings for agricultural commodities find China and India leading the league tables for many soft commodities of significance. Indonesia and Malaysia head the list of the world’s palm oil producers (87% of world total). In cereals, China and India rank number 1 and 2 respectively for wheat and rice; for maize, China is the second largest producer. Asian countries are also leading producers of cash crops, with China and India taking the top two slots in that order for cotton and tea. India is second only to Brazil amongst the top sugar producers in the world. Vietnam holds the second spot among global coffee producers, with Indonesia and India also in the top five. Natural rubber is also dominated by Asian countries, led by Thailand, Indonesia, Vietnam and India in that order. India continues to be the world’s largest spice producer.
 Source: FAOSTAT, Rabobank Analysis
Over the last 50 years, world agriculture production has nearly doubled but the total area harvested has increased by a mere 32%. The implication clearly is that expansion of arable land area has played a less important part in increasing output than crop intensification and yield enhancement. However, these trends are not uniform across the regions. For instance, Asia only marginally increased its share of world area harvested but increased its share of world agriculture output from 34% in 1963 to 47% in 2013. Thus, most of the production growth in land-scarce regions of Asia is due to yield gains and crop intensification. Within Asia, East Asia, where output has tripled with a mere 11% increase in area harvested is at the forefront of this trend.
A brief history of the rapid growth in Asian agriculture
Asian economies emerged from the post-war, post-colonial period with poverty alleviation as the immediate priority. With over four-fifths of the population living in rural areas, agriculture naturally received the main thrust of poverty alleviation programmes. Underpinning this initiative was a basket of agricultural practices – high-yielding seed varieties, access to irrigation, fertilisers, and pesticides – that together dramatically increased crop production between 1970 and 1990. Meanwhile, with the introduction of agricultural reforms in 1978, China began its rebuilding from the disastrous ‘Great Leap Forward’ agricultural collectivisation program. Consequently, wheat and rice yields have dramatically increased in Asia, which has led to a decrease of rural poverty and a build-up of a food surplus in the region within 25 years, despite minimal increases in land acreage.
 Source: FAOSTAT, Asia Development Bank, Rosegrant and Hazell, Rabobank analysis
Several factors are limiting the agricultural production potential of the region
Limited arable land and inadequate water resources in Asia form a natural ceiling to agricultural supply. Consolidation of farmland and better water management have the potential to boost production. At the same time, conflicting demands in land usage and water pollution act as constraints. Given a growing population and increasing demand for cereals for both food and feed, sustained increases in yields are required in Asia. However, factors such as changes in cropping patterns and diminishing returns on modern seed varieties have led to a stagnation of production growth in the last two decades. Increased use of fertilisers as farmers try to maintain productivity is also progressively degrading soil quality in many places. Increased usage of chemical pesticides has further compounded the issue of soil quality and environmental pollution.
 Source: FAOSTAT, Rabobank Analysis
Small and fragmented holding size
The region has the smallest land holdings in the world, with an average holding size of 1 hectare, based on the World Program of Census of Agriculture data 2000. This is further accentuated by the degree of fragmentation of holdings, averaging 3.2 parcels per holding based on data for the period 1995-2005. For most of Asia, the total land cultivated by smallholders comprises a sizeable portion of total agricultural land, rising to as much as 90% in some cases. Given the large incidence of low productivity and low value-added subsistence farming, primary agricultural production in large parts of Asia is well below its inherent potential. (Ref: Asia and Pacific Commission on Agricultural Statistics, April 2010). Land reform that would facilitate farm land consolidation to achieve economies of scale, mechanization and technology adoption has only been incremental due to political and social sensitivities, and archaic laws and restrictive regulations.
Water will be a key limiting factor
In China, water resources per hectare of cultivated land are just two-thirds of the world average level, while water resources are also geographically imbalanced with North China having 60% of cultivated land but only 20% of water resources. Underground water has been heavily relied on, which has resulted in a severe decline in water levels while the efficiency of irrigation is also low. Industrialisation and over-fertilisation have also heavily polluted water sources. In 2013, the government in China’s Guangdong province reported that 44% of rice samples had excessive levels of cadmium. Likewise in India, the water table has been depleted due to excess consumption for food production. The agri sector, which currently accounts for 80% of India’s water consumption by way of irrigation, is highly inefficient in its water usage pattern, and yet 65% of cultivable land has no irrigation facilities. According to IFC estimates, India is likely to have a 50% water deficit by the year 2030. Most water sources have also been contaminated by sewage and agricultural run-off.
Self-sufficiency policy
With the aim of improving living conditions for the rural poor – which accounted for the vast majority of Asia’s population in the 1960s – governments in the region adopted self-sufficiency in food production as the key policy objective. This was also necessitated by the nature of consumption (with rice and pulses dominating the food basket). A self-sufficiency policy aims to have all food consumed domestically produced and controls trade as a mechanism to achieve this goal. Farming improvements that followed substantially improved rural living conditions and also impacted food consumption patterns. Regional governments however continue to desire food security and support food self-sufficiency policies. Many of these programmes, which consist of either minimum purchase price floors or import quotas, have distorted local markets and caused overcapacities and distress and strained national budgets. Examples range from Thailand’s rice programme to the Indian sugar market, and possibly also Indonesia’s recent biofuel programme.
Rising rural wages
Most Asian countries are in transition in terms of the contribution of agriculture to GDP. On average, this has fallen from 30% in the early 1980s to between 10% and 15% today, with the contribution falling below 10% in China, Thailand and Malaysia. Commensurate to this transition was the acceleration in urbanisation led by China, Indonesia and Malaysia. The rapid growth of manufacturing growth across the region since the mid-1990s drew workers away from rural areas, resulting in a dwindling rural work force, except in a few economies. The resultant increase in rural wages is pushing up the cost of production in agriculture in Asian economies. The higher food prices that have resulted could undermine food security plans in the region, forcing governments to seek alternative origins for sourcing. This could also be an impetus to increase the degree and scope of/for mechanisation of agricultural operations. (Ref: ODI, October 2014; Rural Wages in Asia; Steve Wiggins & Sharad Keats).
Impact of climate change
The threat of climate change, which is happening mainly in the tropical regions, is looming large over agricultural production in Asia. One study (Piao et al. 2010) estimates that the yield potential in China for major crops—rice, wheat, and maize—could fall from the 2000 baseline by 15% to 25% by 2050. Yields are expected to decline in tropical regions such as South and Southeast Asia through at least 2100. According to one estimate, relative to 1990, rice yields in Southeast Asia are projected to fall some 50% by 2100 (ADB, 2009). Climate factors would accentuate the already declining growth in cereal production.
The region lags in R&D spend in agriculture
Relative to the world as a whole, Asia’s commitment to agricultural research as measured by public agricultural research and development (R&D) intensity—the ratio of public agricultural R&D spending to agricultural GDP—has been low. However, the region’s spending on R&D has increased rapidly since the 1990s. This is reflected in Asia and the Pacific’s growing share in global public agricultural R&D spending, which has contributed to Asia’s agricultural productivity growth. Maintaining this commitment is essential, especially in light of the growing pressure on resources and the population and economic transformations taking place across Asia and the Pacific.
Is food production or the food supply system the real issue in Asia?

The World Resources Institute (WRI) estimates that Asia, with 17% of food produced subject to losses, compares well with developed economies of North America & Oceania (42%), industrialised Asia (24%) and Europe (22%). While the developed world incurs losses largely at the (downstream) consumption level, losses in South and South East Asia are mainly at the (upstream) production, handling and storage levels.
Investment in physical infrastructure (roads, ports, railway terminals)
Whilst agricultural production has increased, in general the market supply network remains a laggard. Recent investment has however been targeting supply chain and logistics systems and addressing the shift in consumption towards high value foods and increasing consumption of proteins. Regional disparities in physical infrastructure are critical barriers to higher efficiencies in the regional agriculture value chain. Whilst countries such as China and Malaysia have made tremendous improvements in intra-country transport facilities, regional transport infrastructure is patchy, inefficient, or non-existent. On the one hand, this increases the costs of logistics and on the other, it is an important cause of higher transit loss in agriculture output, and thus reduces supply to the market. There is an acute need for investment in improving transport infrastructure. Initiatives such as the New Silk Road and ASEAN Economic Community plan could, if properly executed, give a massive boost to regional agribusiness.
Storage and cold chain logistics
Improving storage and supply chain logistics can boost Asia’s agribusiness in two ways. Firstly, they can reduce food loss and wastage in the upstream value chain. For example, grain storage in India is under severe pressure owing to the fact that buffer stocks with Food Corporation of India (FCI) have been, on average, double the national stocking norms. Consequently, the increasing amount of grain placed in open storage is prone to quality and quantity deterioration from pest and weather damage, underlining the urgent need for improvement in India’s storage infrastructure. In China meanwhile, cold chain networks are suffering from poor operational control and unsophisticated technology, leading to frequent food safety incidents. Secondly, the currently inefficient food trade distribution could be standardised and streamlined by reducing the numerous layers of wholesalers and suppliers in Asia. The requirements for warehouses and temperature-controlled logistics will increase as Asian retail trade transitions from a ‘wet market’ to a modern retail format.
Technology investment to improve farm productivity and farm-business connectivity
Another important way of bolstering existing food supply is by increasing technological intervention at farm level. Whilst enhancing yield rates via conventional options such as hybrid seeds, integrated pest management programmes or better farming practices remain the primary drivers in this regard, other interventions like mechanisation adapted for small holding sizes, efficient water management systems and data management could increasingly find a place in Asian farms. High penetration levels of mobile communication technology could help the dissemination of frequent information on weather conditions, dedicated advice on nutrient and water management and the sharing of best practices in farming via mobile apps entrenching agribusiness connectivity. Rural e-commerce platforms like Alibaba’s Taobao village, which connects farmers to consumers across China and promotes farm development through cloud computing, big data and rural finance could become the blueprint for similar developments in other Asian markets.
Emerging Asian companies leading Asia’s integration into world agri-trade flows
In a world order of agricultural trade flows mostly originating from the Americas (grains, sugar, coffee, soya), Asia rules the global palm oil trade, with Indonesia and Malaysia as key origins. After India and the EU, China is the largest importer of palm oil sourced from Southeast Asia. Another prominent intra-Asian flow is that of aquaculture products from China and Thailand to the mature market of Japan. China’s growing need for protein from animal origin makes it dependent on the US and Latin America (Argentina and Brazil for soybeans (animal feed) and Australia/New Zealand for meat (beef & lamb)). China is also the largest importer of milk powder (primarily from New Zealand) and now has an influential role in global dairy, with significant impact on the milk supplying regions. Increasing evidence of Asia’s external dependence for food is also shown in the form of investment in production assets beyond trade, often driven by sovereign-backed businesses, as is the case in China. The rise of Asian commodity traders and fast-moving consumer group companies with regional and global ambitions in the last couple of decades, with these players joining the ranks of incumbent global players, has further boosted Asia’s integration into the global soft commodity trade.
Asia agriculture 2.0: from farming to agribusiness
Asian agriculture policy has hitherto focused on creating self-sufficiency in food production. As food consumption continues to evolve and Asian countries become better integrated in global agri-trade, the agribusiness approach is likely to become more dominant in the Asian farm landscape, with leading farms becoming more integrated into the food value chain instead of subsistence and low value supply points.
From a market perspective, the direction of growth in Asian agriculture towards an agribusiness approach is almost inevitable. Firstly, limitations in increasing land for farming and stagnating yield growth potential from existing farmland are natural barriers to any substantial increase in agriculture production and creating the pull towards greater integration in world trade flows. Secondly, emerging Asian businesses and food demand from urbanised Asians are also pushing the regional agriculture practice in this direction. Emerging concerns regarding food safety and quality are pushing the sector towards full traceability in the food chain and thus also pushing the market towards the integrated agribusiness approach and supply chain alignments. This trend is most visible among Asian producers catering to some of the niche developed markets.
Annex 1: Country Profiles
China
The share of China’s agricultural sector in its GDP has been consistently declining over the last decade, declining to 9.2% in 2014 from 11.7% in 2005. During the same period, the proportion of the labour force employed by the agricultural sector has fallen from 45% in 2005 to 30% in 2014.
The declining share of agriculture in China’s economy does not mean that agriculture is any less important than in the past. After all, rural China is still where 45% of its population (or 619 million people, almost double the population of the USA) lives, and a still sizeable number of 228 million people were employed in agriculture in 2014.
More importantly, despite limited resources and relatively high production costs, the government’s strategic consideration is to ensure that China strives to maintain self-sufficiency in food grains and varying degrees of sufficiency for other agricultural products, such as feed grains, animal protein, dairy, oilseeds and sugar. Along with the urbanisation process, soaring labour costs owing to the increasing shortage of labour in the agricultural sector, environmental degradation and growing concern over food safety, Chinese agriculture is on the way to a transition which will involve rationalisation of the use of agrochemicals and fertilisers and increased mechanisation in production and harvesting.
An immediately related issue is the system of land ownership in China. Farmland is owned collectively by the village, but individual farmers are entitled to use small patches of land. This makes it difficult to engage modern farming machinery. Consequently, China will have to deepen its reform of the land system and allow consolidation of land by large operators to facilitate the modernisation of agricultural production.
China ranks among the world’s largest producers of several agricultural products. For example, China is the world’s largest producer of pork, aqua products, rice, many fruits (apples, grapes, tangerines, pears etc.), and the second largest producer of poultry, wheat and corn. And yet China only has 6% of the world’s water resources and 7% of the world’s arable land, with the task of feeding 22% of the global population.
Domestic demand for agricultural products and quality processed food products is growing, driven by income growth and urbanisation. However, limited land and water resources, a large population base, relatively low production efficiency, high production costs and consumer concerns over food safety have prompted China to further increase the share of imports in total food in recent years. China has been a net importer of food-related agricultural and processed products over the past five years. In 2014, China recorded an international trade deficit of USD 38 billion in primary and processed food products, almost a four-fold increase on the USD 8 billion deficit back in 2009. Oilseeds is by far the largest import item, accounting for 43% of China’s total imports of primary and processed food products, making it the largest importer globally. In the meantime, China has become the world’s largest importer of animal protein and dairy in recent years. In terms of trade flows, Brazil and the US jointly account for about 85% of China’s soybean imports, Canada for 90% of China’s rapeseed imports, EU and the US for over 82% of China’s pork imports, Oceania and South America for over 95% of China’s beef imports, and New Zealand alone contributes 83% of China’s milk powder imports.
The self-sufficiency agenda and limited domestic resources, combined with the aspirations of domestic consumers to improve their living standards, are driving China’s imports of agricultural and food products as well as its outbound M&A activities to secure offshore assets and supply. While the trend is unlikely to reverse, a slower growing China in its New Normal will nevertheless have a profound impact on global agricultural commodities markets. As suggested by evidence over the last few years, small changes in China’s production, demand and inventory levels are increasing the volatility of global commodity prices markets and in turn, impacting domestic market prices. With its rising dependency on imports for agricultural and food products, it is becoming ever more challenging for the government to cope with food price inflation against the backdrop of a more volatile currency.
India
India’s economic dependence on agriculture has consistently declined over several years. Provisional estimates for 2014-15 indicate that agriculture’s share of national gross value added declined to 16.1% in 2014-15 from 17.2% in the previous year. On the other hand, the share of employment in agriculture was just under 55% in 2011-12, the last year for which data are available. This implies that gross value added per agriculture worker at current exchange rates was USD 940 compared with USD 5,024 for non-agricultural workers. This low gross value added in agriculture is a reflection of low average farm size (1.16 hectares in 2010-11) owing to the large rural population base and the predominance of small and marginal farm holdings (80% of the total below 2 Ha). With the average farmer earning just above the poverty line, this underlines the story of farming in India and underpins government policy in agriculture. Despite these challenges, India is among the world’s top 10 producers for several agri-commodities like spices, milk, tea, coffee, sugar cane, amongst others. At USD 26 billion, agriculture constitutes about 8.3% of total annual exports in 2013-14 and is the fourth largest principal commodity exported. However, agricultural yields in several crops is lagging behind the world average despite growing farm input usage. High farming fragmentation, low use of technology and high dependence on the monsoon for irrigation continue to inhibit India’s yield potential. With consumption patterns changing from mainly cereal to pulses and other high value items, India may need to depend on imports to serve domestic demand going forward.
On a positive note, emerging trends portend an evolving situation on the ground. Firstly, rural income is growing faster than urban income. Secondly, farmers are diversifying out of cereal production into high value and high yielding varieties of crops. Thirdly, as evidenced by the increasing share of agri-trade (the sum of exports and imports) in gross value added of agriculture from about 5% in 1990-91 to about 18% in 2013-14, domestic agriculture is becoming more integrated in the world market. The direct consequence is an improvement in farm income but more importantly, this is expected to introduce global best practices to an antiquated domestic farming system.
Post-harvest linkages remain an ongoing constraint on India’s food & agriculture value chain. On average, goods pass through six or seven middlemen before reaching the ultimate consumer, resulting in large mark-ups and poor quality. The inevitable consequence is wide variation between retail and farm gate prices, creating opportunities for hoarding. To avoid transit and storage loss, farmers focus on immediate market needs and regulation via the Agricultural Produce Market Committee Act continues to encourage this practice rather than support growth of an optimised supply chain network. The emerging modern trade and online food retail channel could become the harbinger of change in India’s agriculture value chain.
Indonesia
Indonesia’s agricultural sector accounted for 13.4% of GDP and employed 34.3% of the population in 2014. Agri exports account for 25% of total exports. Indonesia is a net exporter of agricultural products. Total agricultural exports have averaged USD 85 billion per year in the past three years, and imports USD 24 billion. Indonesia is the world’s largest producer and exporter of palm oil, as well as a leading player in other high value commodities such as cocoa, rubber and coffee. Indonesia is the second largest rubber producer accounting for almost 25% of global production. It remains the third largest cocoa producer and the fourth largest coffee producer accounting for 6-7% of global production.
Similar to Malaysia, palm oil is the most important commodity for the Indonesian agricultural sector, representing 21% of total exports. Rubber is another key agricultural export, which in 2011 generated earnings of USD 11 billion. With the decline in rubber prices however, export income has also declined to around USD 3 billion in 2015. On the import side, Indonesia is still heavily reliant on imports for staple food items such as wheat, soybeans/meal, corn, sugar and beef to fulfil the demand of its growing population. Although Indonesia imports rice, its import dependence is much lower at less than 10% of total demand. Indonesia fully depends on imports for its wheat and soymeal requirement, whereas sugar imports account for almost 50% of domestic needs. For soybeans, corn and beef, 20-30% of domestic demand is met by imports. Indonesia is growing as a key livestock consuming nation with a self-sufficient poultry industry, though relying heavily on Australian imports for beef.
The livestock sector is limping back to normality with the recovery of the poultry industry. High cattle prices in global markets and supply constraints domestically nevertheless continue to challenge the domestic supply chain. After steps taken under the direction of the Indonesian government to cut breeder supply, the market is reaching a more balanced state. Demand for livestock products will continue to expand, though at a slower pace due to economic uncertainties and the impact of the weaker currency. The long term prospects for the sector continue to drive investment. Imports of feed commodities and soymeal are thus expected to increase in 2015/16 in line with growth of the livestock farming sector in 2016.
The palm industry will see better prospects driven by improved prices in 2016, though production growth will be marginal due to unfavourable weather. In the long term, the industry continues to face challenges on the sustainability front. The local biodiesel mandate remains a key driver for palm oil price movement. The productivity of cocoa and coffee plantations will also continue to be uncertain due to El Niño. Rubber producers will continue to feel pressure from low prices (in fact the lowest since the global financial crisis).
Over the past five years, the Indonesian agricultural sector has experienced a period of strong growth, with total value added growing at an average of 4% per year. The government has set the target for agricultural growth at 3.8% per annum for 2015-2019. However, despite these growth rates, Indonesia’s agricultural sector continues to face challenges, notably in the form of poor infrastructure leading to multiple inefficiencies and increased costs. Furthermore, small-scale agricultural businesses are still finding it difficult to obtain finance for investment. Going forward, a key agenda item for the Indonesian government will be to improve self-sufficiency in rice, corn, sugar and beef.
Myanmar
Fishing and agriculture constitute 40% of GDP and employ 70% of the workforce. Myanmar’s agricultural export values have remained roughly flat at USD 2.7 billion. Given its ample land and water resources in the most populous parts of the nation, agricultural production is mostly focused on producing row crops. Agricultural exports account for about one fourth of total exports.
Rice is the most important crop with an export value of USD 613 million, representing 23% of agricultural exports; expanding at a high pace of 25% per annum between 2004/05 and 2014/15. Other key agricultural products include corn, pulses, oilseed and animal protein. Myanmar is the leading producer globally of sesame seeds and the third largest producer of peanut oil, by volume. Myanmar is now the third largest fishery in South East Asia with an average annual production growth rate of 11.8% over the past decade, while export volumes have tripled to reach 450,000 metric tonnes (MT), mainly to Thailand and China. Myanmar is mostly self-sufficient in livestock and continues to develop rapidly driven by growing domestic demand. According to the Food and Agriculture Organisation (FAO), the livestock industry grew at high single-digit rates between 2007 and 2012. In 2015, Myanmar opened its doors to imports of high quality beef and pork from Japan, the US and Brazil to cater to growing domestic demand for meat with the opening up of the economy and concomitant influx of immigrants.
Going forward, agricultural growth will be led by grains and oilseeds and animal proteins development. Rice exports may continue to face headwinds given the importance of rice in the local diet. Recently, the government responded to the flooding in the country by halting rice exports to stabilise domestic prices. With sanctions now lifted, Myanmar is seen as an attractive destination for investment in agribusiness. Many multinational and regional companies are looking to invest in Myanmar to leverage domestic consumption and low labour costs. Rubber, sugar and palm are seen as key plantation crops for investment and will continue to attract capital. Growth of livestock is driving investment in feed and animal nutrition industries. The market for pulses will continue to remain strong, with the continuous widening of the Indian deficit supporting pulse prices in 2016. According to the US Department of Agriculture (USDA), pulses production is expected to marginally increase in 2015/16.
Malaysia
Malaysia’s agricultural sector remains important for its economy. In 2014, the sector contributed 6.9% to GDP and constituted 12.2% of total employment. Malaysia is a net exporter of agricultural products and agriculture makes up about 9% of total exports. Total agricultural exports have averaged USD 32 billion per year in the past three years, while imports averaged USD 23 billion per year
Palm oil, where Malaysia is the second largest producer and exporter globally, is the largest contributor to the Malaysian agricultural sector, representing close to half of total export earnings. Rubber, where Malaysia is the fourth largest producer globally, is another key contributor, though its share in exports shrank in 2014 given the protracted decline in rubber prices. Besides palm and rubber, Malaysia is a key processing base for cocoa in Asia. Malaysia depends on imports of key commodities like rice, sugar, corn, soymeal and corn. Malaysia more or less completely depends on imports to meet demand for sugar, corn and soymeal, whilst for rice the dependence on imports stands at around 35%.
Over the past decade, Malaysia’s agricultural sector has benefited greatly from the palm oil sector, where production and export volumes have grown at average annual rates of 4% and 5% respectively. However, growth has slowed to 2-3% more recently (2009/10-2014/15) due to the fact that there was virtually no room for plantation expansion. Production declined by 1% in 2014/15 and is expected to decline by another 2% in 2015/16 to 19.4 million tonnes. Furthermore, labour shortages have been an obstacle to growth in recent years, as the agricultural sector found it difficult to attract local labour when competing with services and manufacturing sector. The palm industry witnessed record low prices in 2015 (the lowest since the global financial crisis), though palm oil producers are likely to benefit in 2016 given Rabobank’s view that palm oil prices will rise due to supply constraints caused by El Niño.
For agro-food trade (barring palm and rubber), Malaysia is likely to remain a net importer as the path to food self-sufficiency continues to be challenging. The weak Malaysian ringgit, which softened by 19% in 2015, remains the key risk for the country’s imports of commodities.
Malaysia is largely self-sufficient in poultry and has very high per capita consumption at 50kg per annum, on a par with developed markets. The industry nevertheless is expected to continue to expand. The lower commodity price outlook would further support the livestock sector and consumption of grain-based products. Limitations on incremental cultivable land, shortage of labour, increasing import dependence and weakening revenues from agricultural exports would appear to be the structural challenges for the Malaysian agricultural economy. Overall, the projected agriculture sector growth is pegged at a moderate 1.3% growth in 2016 given the challenging economic environment.
The Philippines
The Philippines’ agricultural sector accounted for 11.3% of GDP and employed 30.4% of the population in 2014. Agri-exports account for about 6% of total exports and agricultural GDP has expanded at an average annual rate of 2% in the last 5 years.
The Philippines is a net importer of agricultural products. Total agricultural exports have averaged USD 6 billion per year over the past 3 years, while imports averaged USD 8.6 billion per year. However, exports were down 25% till November 2015, largely driven by lower commodity prices and declining export volumes. Coconut oil, where Philippines is the largest producer and exporter globally, represents 15% of agricultural exports. The Philippines is also the second largest exporter of bananas, with exports worth USD 1.1 billion in 2014 and constituting 14% of total agricultural exports. On the import side, wheat is the main agricultural import at 7.2% of total imports, with the majority coming from the US. For wheat and soymeal, the Philippines is completely dependent on imports, whereas the country maintains healthy self-sufficiency of close to 90% and above for rice, corn and pork. The beef and poultry sectors meet 20-25% of domestic requirements through imports.
Over the past decade, the Philippines’ agricultural sector has experienced a period of moderate growth, with total value added for the sector growing at an annual average of 3.6%. However, the sector continues to be challenged by low productivity, outdated transportation infrastructure and vulnerability to weather. Going forward, government and private sector investments are expected to partially resolve these challenges as initiatives such as farm mechanisation seek to enhance productivity by increasing the use of technology.
In terms of agricultural exports, one key growth area is meat products. The Philippines’ status of being free from avian flu and FMD places it in a unique position to export in the evolving ASEAN Economic Community (AEC), provided it can improve its production efficiencies and become more competitive. The coconut and banana sectors will continue to face headwinds in the near term due to supply constraints caused by El Niño in 2016. The livestock sector is expected to witness positive growth driven by the pork industry (given lower feed prices) and should also drive growth in feed demand. Rice imports are expected to rise in order to meet any shortfall in domestic production due to El Niño for the harvesting year 2015/16. The government intends to achieve growth of 3-4% for the agricultural sector in 2016. However considering weather disruption and subdued economic conditions at the global level, this growth target appears to be challenging.
Thailand
According to World Bank estimates, agriculture alone currently makes up for about 9% of Thailand’s total GDP. Agricultural GDP has been growing at 2-3% per annum over the last five years. However growth has remained sluggish in 2013-14.Thailand has strong production in rice, sugar, cassava, rubber and seafood. Thailand is the largest producer of rubber (representing one-third of global production), the second largest in cassava, and the fourth largest in sugar production. Its strong agricultural industry makes Thailand a key global exporter. In 2014, agricultural exports amounted to USD 50 billion and accounted for 17% of total Thai exports. Thailand is the global leader in production and exports of natural rubber and cassava, the top exporter of rice (24% of global exports), the second largest exporter of sugar (15% of global exports), and the third largest exporter of palm oil. As for animal protein, Thailand is a leading exporter of poultry in Asia and used to be the top exporter of shrimps worldwide before the EMS disease struck the country in 2012. Thailand is also one of the world’s top ten producers and exporters of processed food products, leading the beer export market in Asia and canned pineapple exports worldwide.
Despite declining production due to acreage shifts away from rice after the collapse of the populist rice buying programme, Thailand is likely to maintain its number one position as rice exporter in 2016 by exporting 10 million tonnes of rice. Sugar production is expected to decline due to unfavourable weather caused by El Niño, however exports will remain strong due to large carryover of stocks. The fate of the rubber industry also remains in doubt due to global over-supply, slow economic growth and lower crude prices despite the government’s attempt to withdraw inventory from the market. The seafood sector, recovering from the impact of the EMS disease, continues to face uncertainty and volatility due to lower shrimp prices and further disease outbreaks. Shrimp production is expected to grow by 10% in 2016. Unlike seafood, the poultry industry may face challenging times due to reduced availability of breeder stocks on the back of a ban imposed by the government on imports of birds from the US due to bird flu. Poultry exports will continue to face competition from other suppliers due to the relative strength of the Thai baht. Thailand is placed strongly and is expected to benefit from integration of the ASEAN economic community in rice, sugar and livestock industries driven by its competitiveness.
Vietnam
Vietnam has a broad agricultural base accounting for 18% of GDP and close to 70% of employment in agriculture. Agricultural GDP has grown by 3% per annum during the past 5 years (2011-2015). Vietnam is a strong producer of rubber, coffee, rice, cassava and seafood and has a significant position in the export markets for these products. Vietnam is the second largest producer of coffee (17% of the global market), the third largest producer of rubber (9% of the global market), the fifth largest producer of rice (6% of the global market) and has the world’s fifth largest pig herd. As an exporter, Vietnam is the second largest in rice and coffee, the third largest in rubber and a significant exporter of seafood.
Vietnam exported USD 22 billion worth of agricultural products in 2014, up 11% from 2013. Seafood exports remains the most valuable component of agricultural exports at about USD 8.0 billion, representing 36% of total agricultural exports. Coffee follows with an export value of about USD 3.5 billion, translating to 15.7% of total agricultural exports. Rice exports bring in a value of about USD 3.0 billion, representing 13.5% of total agricultural exports. Major import items include feed commodities (especially soymeal), wheat, and dairy products.
Looking ahead, the agricultural sector holds promising prospects in 2016, with strong growth opportunities in livestock and the seafood sector. Coffee production is expected to grow despite lower rainfall but will face headwinds due to lower prices. Rice will maintain production in 2015/16 at the previous year’s level and exports are likely to remain flat. Feed industry growth will be supported by growth of the livestock sector and will lead to stronger demand for feed commodities. According to the Vietnam Statistics Office, pork herd expansion is expected to lift production by 4% in 2016. The poultry industry will go through demand-supply discipline due to slight oversupply caused in 2015. Rubber also continues to face challenging times with low prices and the slowdown in China. The dairy industry is undergoing strong growth and transition with large investments in milk production systems.
The Vietnamese agri-industry is perceived to benefit further from economic and financial integration in South East Asia (the ASEAN Economic Community) with investments happening in the agricultural supply chain. Vietnam has also concluded a free trade agreement with the EU which is likely to boost trade in coffee, rice and seafood. Vietnam is part of the Trans Pacific Partnership (TPP), which is largely perceived to be beneficial for the country but could have an unfavourable impact on the livestock industry due to domestic inefficiencies and lower competitiveness. Although TPP ratification is pending and the full implications will take time to become clear, the focus of domestic industry has to shift towards improving the efficiency of production systems. The government has kept a growth target of 3-3.5% for 2016 and defined a 5-year plan, in which growth will be driven by modernisation, added value and large scale farming.
Australia
The Australian food and agricultural (F&A) sector is a relatively small but important contributor to the Australian economy, which these days is predominantly a services-based economy. Overall, the agricultural and food and beverage manufacturing sectors represented roughly 4% of total Australian industry gross value added in 2014-15.
Despite the gross value of agricultural production having expanded by nearly 50% over the past decade to AUD 53.5 billion in 2014-15, the sector’s relative contribution to the economy has declined somewhat over the period, largely owing to the rapid expansion of the mining and services sectors (ABARES, 2016). Nevertheless, strong demand for Australia’s food and agricultural exports in the Asian region and a relatively robust domestic economy are expected to underpin a stabilisation in the relative economic contribution of the sector moving forward. Aside from primary production, food manufacturing is one of Australia’s few remaining competitive manufacturing industries, and Australia’s largest manufacturing sub-sector.
 Source: ABARES, Rabobank, 2016
The four largest sub-sectors in Australia’s agricultural sector are beef, grains and oilseeds, dairy and horticulture, but Australian farm, forestry and fisheries production is also very diverse (figure 5). While Australia’s variable climate is a key systematic risk that all sub-sectors must manage, the sector’s diversity gives it the capacity to diversify other more sub-sector idiosyncratic production and market risks. A snapshot of the gross value of production across the last two years reveals the sort of variation across sectors and seasons that is inherent in the Australian agricultural sector.
Until only recently, real prices received by Australian farmers for their agricultural products have been declining over a long period. The deflation experienced in farm prices has largely been a consequence of major agricultural producing countries around the world driving strong productivity gains through increased scale and production technologies, as well as the gradual deregulation of agricultural product markets and trade both at home and abroad. More recently, this trend has been reversed as new developing markets, particularly those in East Asia, have injected added demand for many of Australia’s food and agricultural products.
 Source: ABARES, Rabobank, 2016
 Source: DFAT, Rabobank, 2016
Food and agricultural products contributed almost 15% of the value of Australia’s exports in 2014-15 (ABARES, 2016). Australia’s relatively small domestic market means that it plays a disproportionately large role in the global trade of wheat (world’s fourth largest exporter by volume), dairy (fourth), beef (third), wool (first), cotton (third), sugar (third) and wine (fifth). Australia’s exports of food and agricultural products have been steadily rising and increasingly destined for Asian markets over the past decade (figure 7).
To remain globally competitive, over recent decades Australian agriculture has had to embrace deregulation and the need to consolidate production and adopt greater scale economies. A natural consequence of this process has been a gradual fall in the number of agricultural businesses over recent decades but a commensurate increase in their average size. Debt levels have also increased significantly to enable farm aggregation (see also Weernink & Kalf, 2016), but from a low base relative to businesses in many other sectors of the economy.
Average equity levels are generally still positioned at manageable levels in the Australian agricultural sector to account for the variability in income that farmers must contend with on an annual basis. At the same time, there is a growing need to maintain access to adequate streams of equity capital as the sector confronts the need for farm succession planning as owner-operators of family farms become older. Planning for this transition is increasingly becoming a priority, while new investment structures are likely to emerge to facilitate it. Corporate and institutional investment in Australian agriculture, from both domestic and foreign sources, is beginning to play an increasing role in this respect alongside the traditional family farming structure.
The influential role of Australian agriculture in global trade, as well as the developed and high income nature of Australia’s consumer market and stable geopolitical environment, has meant that foreign investment in the Australian food and agricultural sector has been a feature for some time. While the usual political sensitivities surrounding offshore investment in the sector have driven some recent changes in the approval and monitoring of foreign investment flows, it will remain an important source of capital for the sector into the foreseeable future that will see it become even further integrated into the global economy.
New Zealand
Many of the same characteristics and dynamics that describe the Australian food and agriculture sector are also typical of New Zealand’s food and agriculture sector, although the sector is a more significant contributor to the New Zealand economy. Primary agriculture, forestry and fishing represents roughly 6% of total New Zealand industry gross value added, while the food and beverage manufacturing sector contributes a further 3.5% to the economy. This relative contribution has declined by a little over one percentage point over the course of the last decade as the economy continued its transition to a services base, but has since stabilised.
 *NB: Equivalent data for the Forestry and Fisheries sub-sectors not available
Source: NZ Treasury, Rabobank, 2016
The dairy sector is New Zealand’s largest agricultural sub-sector by some margin, while the sheep and beef, and horticulture sub-sectors are also major contributors (figure 8). While estimates of the gross value of production are not yet available beyond 2013-14, the more recent decline in global dairy prices and New Zealand dairy production is likely to weigh on the sector’s economic contribution in 2014-15, and particularly in 2015-16. At the same time, the other major sub-sectors have experienced buoyant trading conditions in recent times, helping to cushion this impact on the overall performance of the sector.
Prices received by New Zealand farmers have risen strongly over the past 10 years but displayed significant volatility over that period, largely stemming from the volatility in global dairy markets (figure 9). Dairy prices continue to trade at a significant discount to their 2013-14 highs, pulling down New Zealand’s broader terms of trade despite some relief from the depreciating New Zealand dollar.
 Source: ANZ, Rabobank, 2016
 Source: Statistics NZ, Rabobank, 2016
Agriculture, forestry and fisheries products contributed three-quarters of New Zealand’s NZD 48.4 billion of merchandise trade in 2014-15. Dairy products alone represent roughly 30% of this figure. Exports have increased in value by almost 80% over the past ten years, with East Asian destinations (especially China) dramatically rising in share.
Much akin to its Australian counterpart, the New Zealand food and agricultural sector has had to embrace deregulation and open up to global competition over recent decades. As a consequence, the same use of leverage to pursue economies of scale and adoption of modern farming practices have been key to underpinning productivity gains that maintain the sector’s global competitiveness.
On a somewhat less tangible level, New Zealand’s global competitiveness and positioning in global markets is also underpinned by its ‘clean, green’ brand based on the integrity of its natural environment and its primary producers’ strong record in environmental sustainability. However, in more recent times the rapid growth of the country’s agricultural sector, especially the dairy sector, has posed growing risks to this well-founded reputation. As a consequence, increasing environmental regulation is being imposed on primary producers in order to protect this reputation. While this entails higher costs for the industry, over time the sector appears well placed to adapt its practices and better leverage this reputation in global markets.
As farms have consolidated, less labour and increased capital inputs have been employed to make the remaining workforce more productive. Following a period of rapid growth, bank lending to the sector has slowed over recent years, notwithstanding the rise in 2014-15 in response to declining profitability in the dairy sector (figure 11).
 Source: Reserve Bank of NZ, Rabobank, 2016
 Source: Reserve Bank of NZ, Rabobank, 2016
Report – Flood Losses in Europe to Increase Fivefold by 2050
The European Environment Agency recently published a report on flooding in Europe, “Floodplain management: reducing flood risks and restoring healthy ecosystems”, where researchers examined data on floods dating from 1980 to 2010, and found significant increases in flooding – which will only get worse as time goes on.
The study assessed the data, researchers have predicted that by 2050, flood losses will have increased fivefold. The fivefold increase in occurrence was attributed to climate change and increasing value of land around the floodplains, and urban development.
3,500 Flood Events in Europe Between 1980 to 2010
The study also revealed that between 1980 and 2010, 37 European countries registered 3,563 floods in total. The highest number of floods was reported for 2010 (321 floods), when 27 countries were affected. This number is associated with the ‘Central European floods’, which occurred across several Central European countries during May and June 2010.

Note: Flood severity is an assessment of flood phenomena magnitude. It considers the reported values on frequency, reported total damage (in Euros and descriptive classes), number of flood events within one flood phenomena unit and severity classes as reported in the Dartmouth Flood Observatory database (ETC/ICM, 2015b). All phenomena with fatalities are in the ‘very high’ severity class.
Italy and Hungary Most Exposed
Based on reporting from nine countries, the report maps the share of population living in floodplain areas. Among those countries, Italy has the largest population living in flood-prone areas (6.7 million people, 11% of the population) whereas Hungary has the highest relative share of people living in such areas (1.8 million, 18% of the population).
Increase in Flood Losses
According to the study, the rise in floods will only continue. The study expects flooding instances to increase by seventeen-fold by 2080. More rain will fall as the years pass because of climate change, which will contribute to about one fifth of future flood damage. But the majority of the cause will be from building on wetlands.
Annual flood losses can be expected to increase fivefold by 2050 and up to 17‑fold by 2080. The major share of this increase (70–90%) is estimated to be attributable to socio‑economic development as the economic value of the assets in floodplains increases, and the remainder (10–30%) to climate change.

Adapting Infrastructure
The study claims that infrastructure will have to be adapted in order to cope with flooding in the future, and suggested that maintenance of existing floodplains was key, whilst building new methods, and using river basins. One of the authors Beate Werner said:
“We need to free up areas for a more natural way of flood protection, giving room for the river.”
This method proved successful after Germany and the Netherlands suffered from terrible flooding in 1995, when the Rhine river burst its banks. In areas where there were fewer communities, man-made defences were destroyed so as to re-join the river with the surrounding wetlands. The study insists that this is the way forward in flood control. Floodplain land should be kept as it is – serving its purpose as was intended, in areas where fewer people live.
Wetlands International’s Jane Madgwick said last year:
“Damaged ecosystems, like the destruction of floodplains, are the hidden hand behind many supposedly natural disasters. They can be what turns extreme weather into human calamity.”
The report suggested that other European countries take the findings into account, particularly the UK which has suffered from extreme flooding over the last few winters. The UK Government are currently looking into more serious flood prevention, and the EEA’s study could be the key to its future.
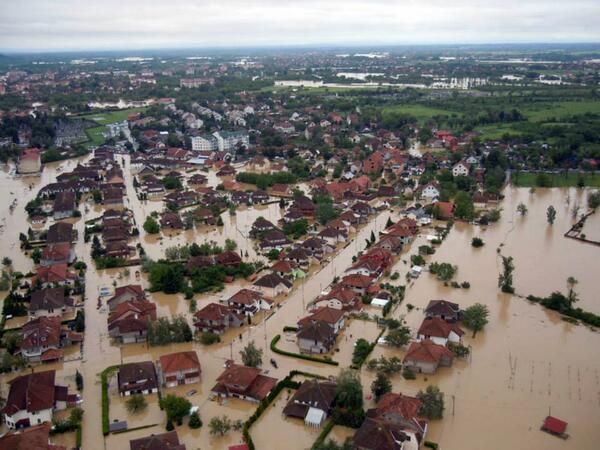
Economic impacts of flooding in the UK – Grantham Institute
 Flooding at a retail park in Leeds during December 2015
New figures released by the Association of British Insurers (ABI) suggest that the economic losses from flood and storm damage over the last couple of months will exceed those from two years ago during the wettest winter on record.
The ABI estimates that its members will pay out about £1.3 billion for claims following a series of storms and heavy rainfall.
Calculations of the economic losses from the winter 2013-14 have been completed by the Environment Agency but have not yet been published by the Department for Environment, Food and Rural Affairs. In March 2014, the ABI indicated that insurance claims would cost £1.1 billion, including £446 million for businesses and homes that were flooded.
The bill for damage so far this winter will also exceed the estimated £600 million in losses caused by flooding in autumn 2012, but will be much less than the £3.2 billion cost (PDF) of summer floods in 2007.
The UK Climate Change Risk Assessment (PDF), which was published in 2012, concluded that losses from coastal and river flooding in England and Wales could rise from an annual average of about £1.2 billion today to between £1.6 and £6.8 billion by the 2050s.
Cause of the recent floods
The floods in northern England and parts of Scotland over the past couple of months have been caused by record rainfall. Last month was not just the wettest December for the UK since Met Office records began in 1910, but the wettest calendar month of any year. Rainfall was well above average, by two to four times, in the west and north of the UK, but close to average over much of central and southern England.
By contrast, in winter 2013-14, much of Scotland and south-east England received rainfall amounts that were double the long-term average, with the most significant flooding in the Somerset Levels and Thames valley.
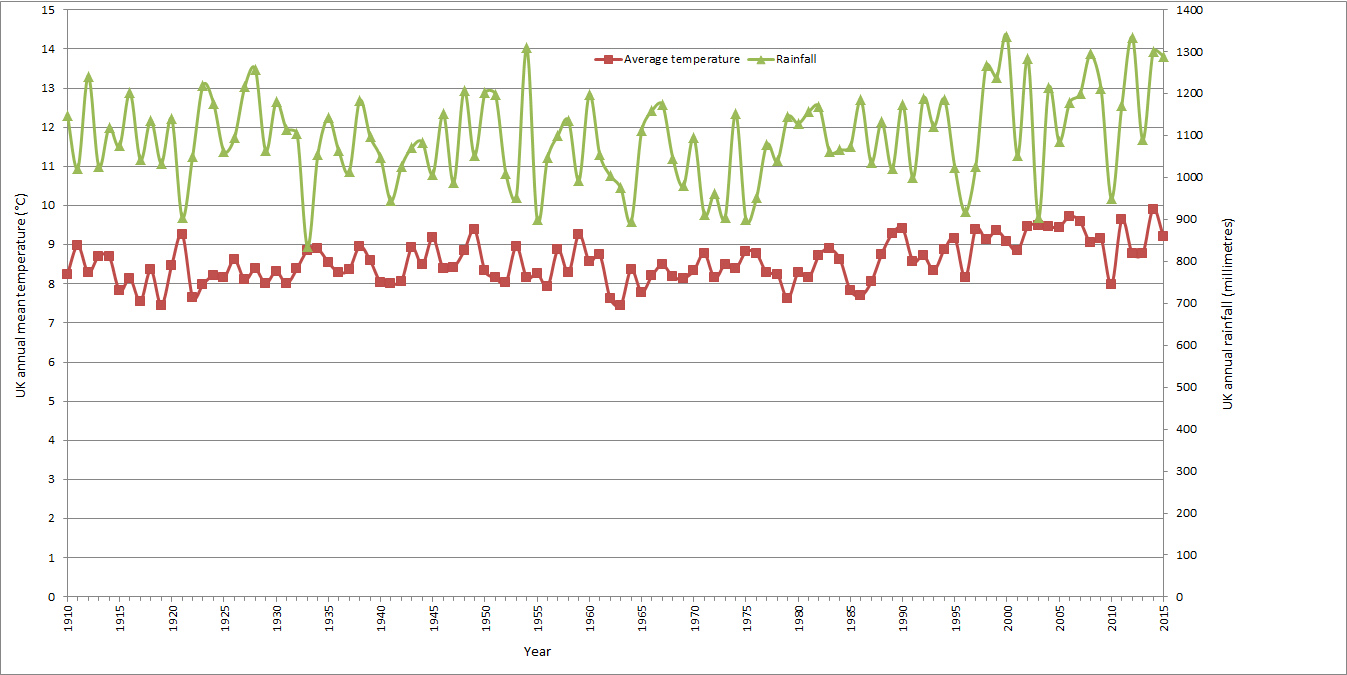 View larger version of this chart
The journal ‘Hydrology and Earth System Sciences’ published a paper by Geert Jan van Oldenborgh and co-authors which concluded that the heavy rainfall which fell on northern England and Scotland during Storm Desmond between 4 and 6 December 2015 had been made 40 per cent more likely by climate change.
This record rainfall is part of a pattern, with six of the seven wettest years (TXT) on record in the UK all having occurred from 2000 onwards. Over the same period, the UK has experienced its eight warmest years (TXT). It is clear that climate change is making the UK warmer and wetter.
The Met Office has warned (PDF): “There is evidence to suggest that the character of UK rainfall has changed, with days of very heavy rain becoming more frequent. What in the 1960s and 1970s might have been a 1 in 125 day event is now more likely a 1 in 85 day event.”
A study by Dr Mari Jones and co-authors in 2012 concluded (PDF) that spring and autumn extreme rainfall events have increased in the UK, and longer duration rainfall events in summer and winter have increased in intensity.
Managing UK flood risks
There are three main sources of flood risk in the UK: coastal, river and surface water. Climate change tends to increase the risk of coastal flooding due to sea level rise, and to increase the risk of river and surface water flooding through heavier and more frequent rainfall events. The UK Climate Change Risk Assessment (PDF) estimated that about 6 million residential and non-residential properties in the UK are exposed to some level of risk of coastal, river or surface water flooding.
It has been suggested that the risk could be limited by preventing any further development on floodplains. However, this is not feasible as coastal and river floodplains cover large parts of the UK, and many of its cities and towns, including London, are built on floodplains.
However, flood risks can be managed in a number of other ways, for instance by restricting development in the areas of highest flood risk, by building and maintaining flood defences, by improving drainage, and by designing buildings to be ‘flood-resistant’ (ie buildings that suffer minimum damage when they are flooded).
Many businesses and households also manage the risk of losses due to flooding through insurance. The UK is different from most other countries because flood insurance is widely available. There has been a tradition for the premiums for flood insurance for households in the highest risk areas to be implicitly subsidised by other policy-holders. In 2016, a new scheme, Flood Re, will be introduced to explicitly provide these subsidies for homes built before 2009, with the aim of phasing them out within 20 to 25 years. When the UK Department for Environment, Food and Rural Affairs initially proposed the scheme, it did not take into account the impact of climate change (PDF) on flood risk.
In its annual progress report to Parliament (PDF) in June 2015, the Committee on Climate Change pointed out that the UK Government’s investments in flood defences were insufficient to take account of the impacts of climate change and other factors. It stated: “Over the last four years there has been underinvestment in flood and coastal risk management in England, totalling more than £200 million. Due to this underinvestment, expected annual flood damage will be higher now than it was in 2010.”
The Committee recommended that the Government should develop a strategy to address the increasing number of homes in areas of high flood risk, with the ‘Flood Re’ subsidised flood insurance scheme playing a central role”. However, in its response (PDF) in October 2015, the Government rejected this advice on the grounds that it “would not be appropriate at this time”.
Following the flooding caused by Storm Desmond, the Secretary of State for Environment, Food and Rural Affairs, Elizabeth Truss, announced the creation of a National Flood Resilience Review to “better protect the country from future flooding and increasingly extreme weather events”. The results of the review are due to be published in summer 2016.
UK Government response to flooding must protect the most vulnerable – Joseph Rowntree Foundation
The recent extreme flooding in York, where the Joseph Rowntree Foundation is based, has amplified our concerns about the adequacy of current flood risk management and how well protected the most vulnerable are from the impacts of extreme weather.
In the east of York, the floods have devastated over 300 homes, including a Traveller site. As homeowners, campaigners and politicians look at what can be done to prevent damage in the future, it’s vital that we consider how social vulnerability affects people’s ability to cope with floods.
The Yorkshire and Humber region is one of the areas with highest vulnerability to flooding nationally. High levels of social or economic disadvantage mean that residents are likely to need greater protection from flooding.
River and coastal flood disadvantage
In 2015 JRF published an analysis of national flood investment which looked at the relationship between flood investment and communities that may be most disadvantaged by flooding in England due to experiencing both high exposure to flood risks and also high social vulnerability. The most socially vulnerable include people who:
- will be more deeply affected by flooding, including older people or people in poor health;
- face increased exposure due to their physical environment such as living in basement or ground floor flats, areas with no green space to absorb surface water run off or mobile homes;
- are on low incomes and might struggle to recover from the damage.
National flood policy must take into account groups of people who are at further disadvantage due to their socio-economic circumstances and physical environment. Resources need to be allocated according to the most flood disadvantaged neighbourhoods. However our report found that only 100 of the 1,493 planned flood investment schemes currently in the pipeline are in the 249 neighbourhoods with the highest exposure to flood risk and the most social vulnerability. The average planned expenditure per local authority per household protected was £6,610, but some areas with fewer flood disadvantaged neighbourhoods were due to receive much higher spending than those with a greater number.
Of course there are complexities here about the location of defences in relation to areas protected and the varying costs of defences. The Government now has the opportunity to use the national flood resilience review, to consider whether its current approach to flood investment adequately addresses issues of social vulnerability or wider deprivation, or whether a minimum standard of protection is needed for the most disadvantaged neighbourhoods in the UK.
As climate change makes severe floods more likely, flood planning needs to better account for extreme weather, rather than viewing it as an ‘unprecedented’ phenomenon. JRF will be conducting new research in 2016 to examine which communities may be at greatest risk across the UK, the social vulnerability of these communities and the adequacy of existing responses. We hope that this work will inform future national and local responses and enable us to build our resilience to flooding and protect those in greatest need. The Government’s review of flood resilience should follow the same principles.