
(Source: NOAA) The National Centers for Environmental Information (NCEI) is the Nation’s Scorekeeper in terms of addressing severe weather and climate events in their historical perspective. As part of its responsibility of monitoring and assessing the climate, NCEI tracks and evaluates climate events in the U.S. and globally that have great economic and societal impacts. NCEI is frequently called upon to provide summaries of global and U.S. temperature and precipitation trends, extremes, and comparisons in their historical perspective. Found here are the weather and climate events that have had the greatest economic impact from 1980 to 2016. The U.S. has sustained 203 weather and climate disasters since 1980 where overall damages/costs reached or exceeded $1 billion (including CPI adjustment to 2016). The total cost of these 203 events exceeds $1.1 trillion.
2016 in Context…
In 2016, there were 15 weather and climate disaster events with losses exceeding $1 billion each across the United States. These events included a drought event, 4 flooding events, 8 severe storm events, a tropical cyclone event, and a wildfire event. Overall, these events resulted in the deaths of 138 people and had significant economic effects on the areas impacted. The 1980–2016 annual average is 5.5 events (CPI-adjusted); the annual average for the most recent 5 years (2012–2016) is 10.6 events (CPI-adjusted).
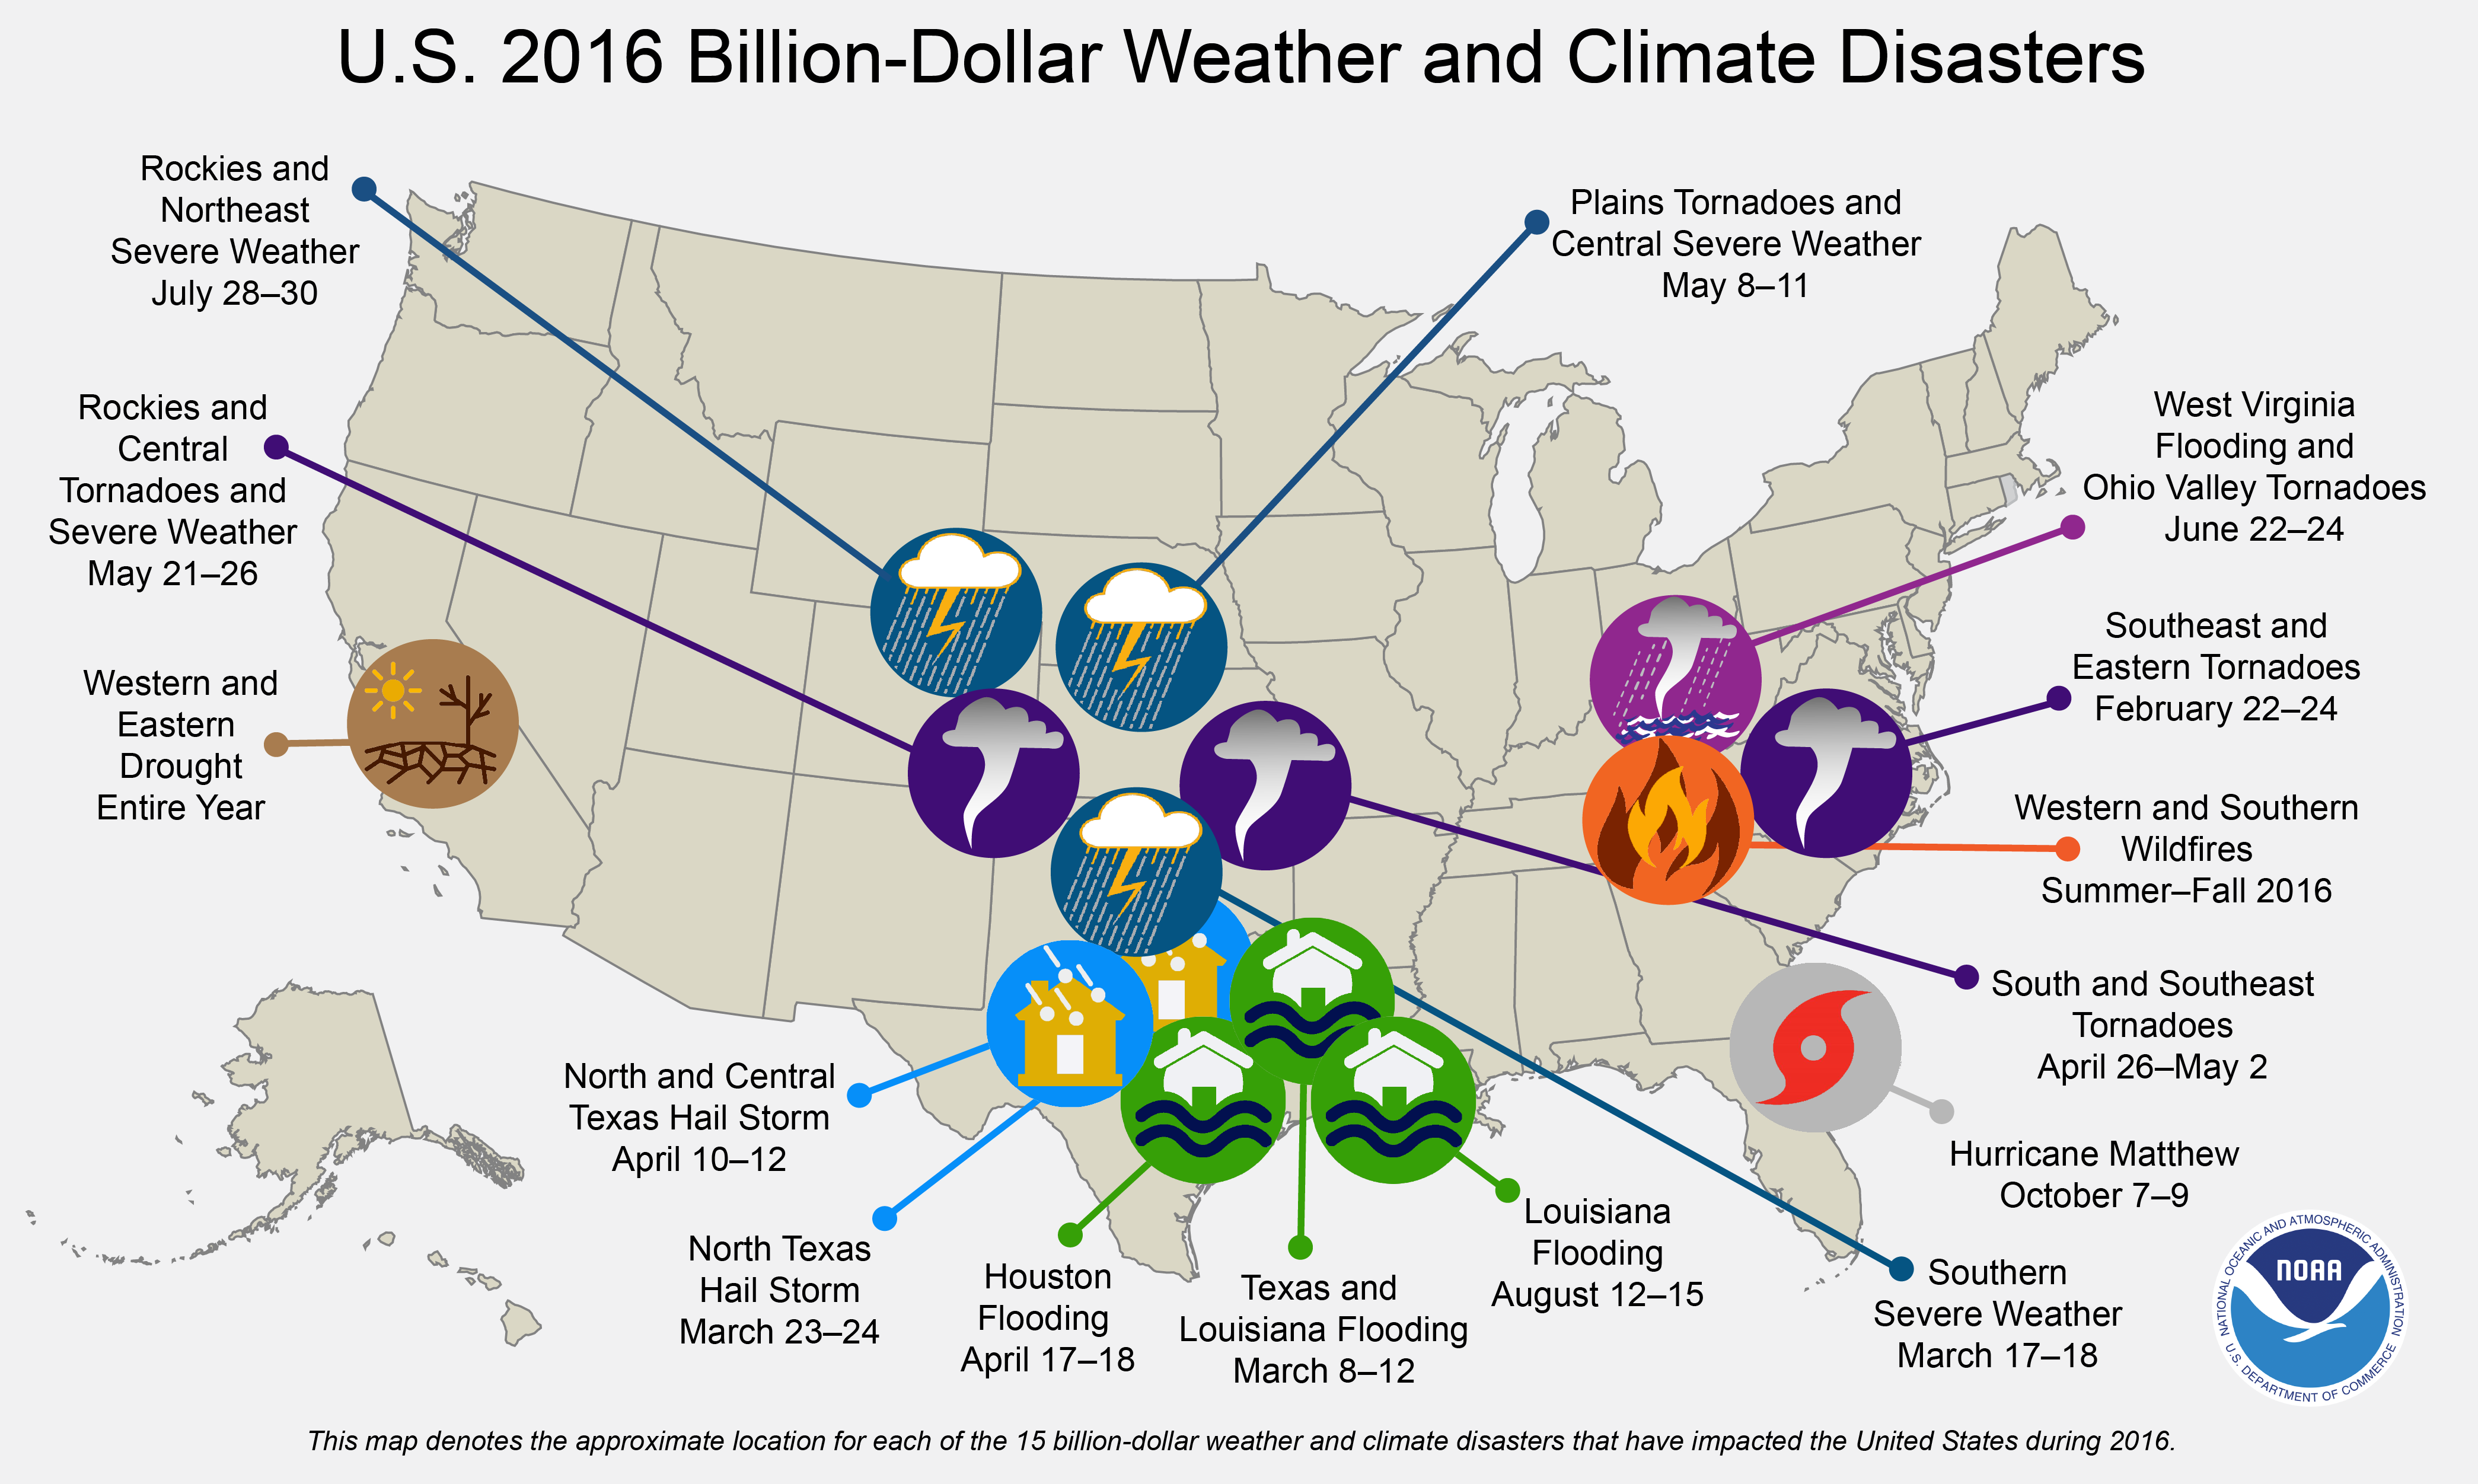
Three new billion-dollar disaster events were added during the 4th quarter, bringing the 2016 total to 15 events. This represents the 2nd highest total number of events surpassing the 11 events observed in 2012. The record number of events in one year (since 1980) is 16, as observed in 2011.
The U.S. has also experienced 4 billion-dollar inland flood events during 2016, doubling the previous record, as no more than 2 inland flood events have occurred in a year since 1980. This is a notable record, further highlighted by the numerous other record flooding events that have impacted the U.S. in 2016.
Methodology and Data Sources
In 2012, NCEI — then known as National Climatic Data Center (NCDC) — reviewed its methodology on how it develops Billion-dollar Disasters. NCEI held a workshop with economic experts (May, 2012) and worked with a consulting partner to examine possible inaccuracy and biases in the data sources and methodology used in developing the loss assessments (mid-2013). This ensures more consistency with the numbers NCEI provides on a yearly basis and give more confidence in the year-to-year comparison of information. Another outcome is a published peer-reviewed article “U.S. Billion-dollar Weather and Climate Disasters: Data Sources, Trends, Accuracy and Biases” (Smith and Katz, 2013). This research found the net effect of all biases appears to be an underestimation of average loss. In particular, it is shown that the factor approach can result in an underestimation of average loss of approximately 10–15%. This bias was corrected during a reanalysis of the loss data to reflect new loss totals.
It is also known that the uncertainty of loss estimates differ by disaster event type reflecting the quality and completeness of the data sources used in our loss estimation. In 2016, six of the fifteen billion-dollar events (i.e., the 4 inland flooding events, drought and Hurricane Matthew) have higher potential uncertainty values around the loss estimates due to less coverage of insured assets. The remaining nine events (i.e., 8 severe storm events and wildfire) have lower potential uncertainty surrounding their estimate due to more complete insurance coverage. Our newest research defines the cost uncertainty using confidence intervals as discussed in the peer-reviewed article “Quantifying Uncertainty and Variable Sensitivity within the U.S. Billion-dollar Weather and Climate Disaster Cost Estimates” (Smith and Matthews, 2015). This research is a next step to enhance the value and usability of estimated disaster costs given data limitations and inherent complexities.
In performing these disaster cost assessments these statistics were taken from a wide variety of sources and represent, to the best of our ability, the estimated total costs of these events — that is, the costs in terms of dollars that would not have been incurred had the event not taken place. Insured and uninsured losses are included in damage estimates. Sources include the National Weather Service, the Federal Emergency Management Agency, U.S. Department of Agriculture, other U.S. government agencies, individual state emergency management agencies, state and regional climate centers, media reports, and insurance industry estimates.
References
- Smith, A., and J. Matthews, 2015: Quantifying Uncertainty and Variable Sensitivity within the U.S. Billion-dollar Weather and Climate Disaster Cost Estimates. Natural Hazards.
DOI: 10.1007/s11069-015-1678-x - Smith, A., and R. Katz, 2013: U.S. Billion-dollar Weather and Climate Disasters: Data Sources, Trends, Accuracy and Biases. Natural Hazards.
DOI: 10.1007/s11069-013-0566-5 - Lott, N., and T. Ross, 2006: Tracking and evaluating U. S. billion dollar weather disasters, 1980-2005. Preprints. AMS Forum: Environmental Risk and Impacts on Society: Successes and Challenges, Atlanta, GA, Amer. Meteor. Soc., 1.2.
- Lott, N., and T. Ross, 2003: A Climatology of 1980-2003 Extreme Weather and Climate Events, Technical Report.
Citing this information:
NOAA National Centers for Environmental Information (NCEI) U.S. Billion-Dollar Weather and Climate Disasters (2017). https://www.ncdc.noaa.gov/billions/