New report on stranded assets

Stranded assets are defined as assets that have suffered from unanticipated or premature write-downs, devaluation or conversion to liabilities. In recent years, the issue of stranded assets caused by environmental factors, such as climate change and society’s attitudes towards it, has become increasingly high profile.
Changes to the physical environment driven by climate change, and society’s response to these changes, could potentially strand entire regions and global industries within a short timeframe, leading to direct and indirect impacts on investment strategies and liabilities.
The report, part of Lloyd’s emerging risk report series, looks at actual and potential examples of how stranded assets caused by societal and technological responses to climate change could affect assets and liabilities in the insurance and reinsurance sector. The study aims to increase the understanding and awareness of these issues in the industry.
To do so, it analyses the following eight asset-stranding scenarios in various business sectors:

  • Upstream energy assets: oil and coal reserves become stranded due to international, top-down carbon budget constraints (i.e. “unburnable carbon”)
  • Upstream energy liabilities: third-party liability claims against companies (and their D&Os) responsible for climate change
  • Downstream energy assets: premature closure of coal power stations due to concerns about climate change and the fossil-fuel divestment campaign
  • Downstream energy liabilities: an increase in political risk events due to government energy policies induced by climate-change concerns
  • Downstream energy assets: residential solar PV and electricity storage (in part connected to electric vehicles) impairs centralised electricity generation market
  • Residential property assets: mandatory energy efficiency improvements reduce the value of the least efficient housing stock and increase the value of the most efficient housing stocks
  • Commercial property liabilities: property industry professionals and governments are sued for negligence for not disclosing, reporting or for being misleading on the climate change impacts for property investors
  • Shipping assets: pressure to reduce carbon emissions increases the value of newer, larger, more efficient ships and reduces the value of older, smaller, less efficient ships

The report sets out a number of key actions that companies including insurers, could take in their role as investors to identify and mitigate stranded asset risks.
Download the report: Stranded Assets: the transition to a low carbon economy: Overview for the insurance industry here

Cranking Up The Intensity: Climate Change and Extreme Weather Events

Climate change is now influencing all extreme weather events – with some of the most severe climate impacts occurring in 2016, our latest report has found.
Cranking Up The Intensity: Climate Change and Extreme Weather Events finds that while the links between climate change and some extreme weather events such as bushfires and heatwaves are well-established, the evidence linking climate change to storms and heavy rainfall is also growing.

DOWNLOAD THE REPORT

DOWNLOAD THE INFOGRAPHICS

KEY FINDINGS

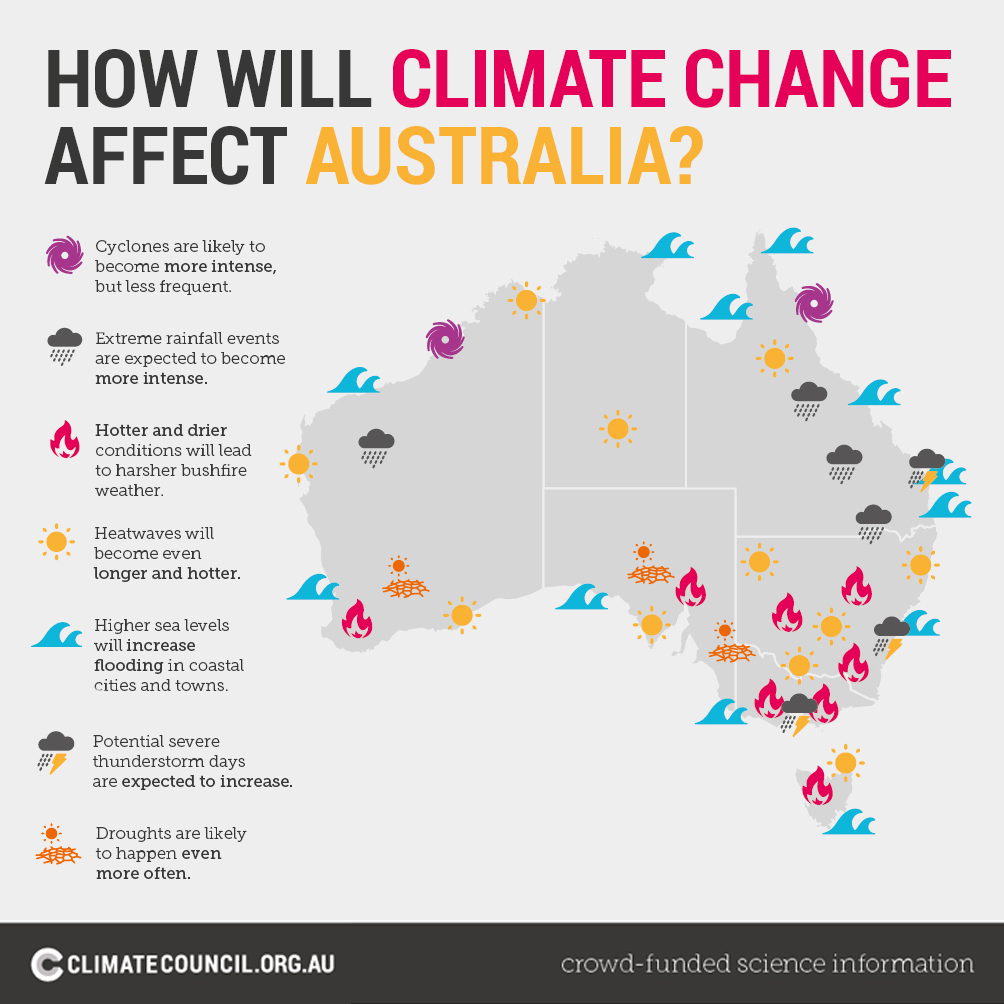
1. Climate change is influencing all extreme weather events in Australia.

  • All extreme weather events are now occurring in an atmosphere that is warmer and wetter than it was in the 1950s.
  • Heatwaves are becoming hotter, lasting longer and occurring more often.
  • Marine heatwaves that cause severe coral bleaching and mortality are becoming more intense and occurring more often.
  • Extreme fire weather and the length of the fire season is increasing, leading to an increase in bushfire risk.
  • Sea level has already risen and continues to rise, driving more devastating coastal flooding during storm surges.

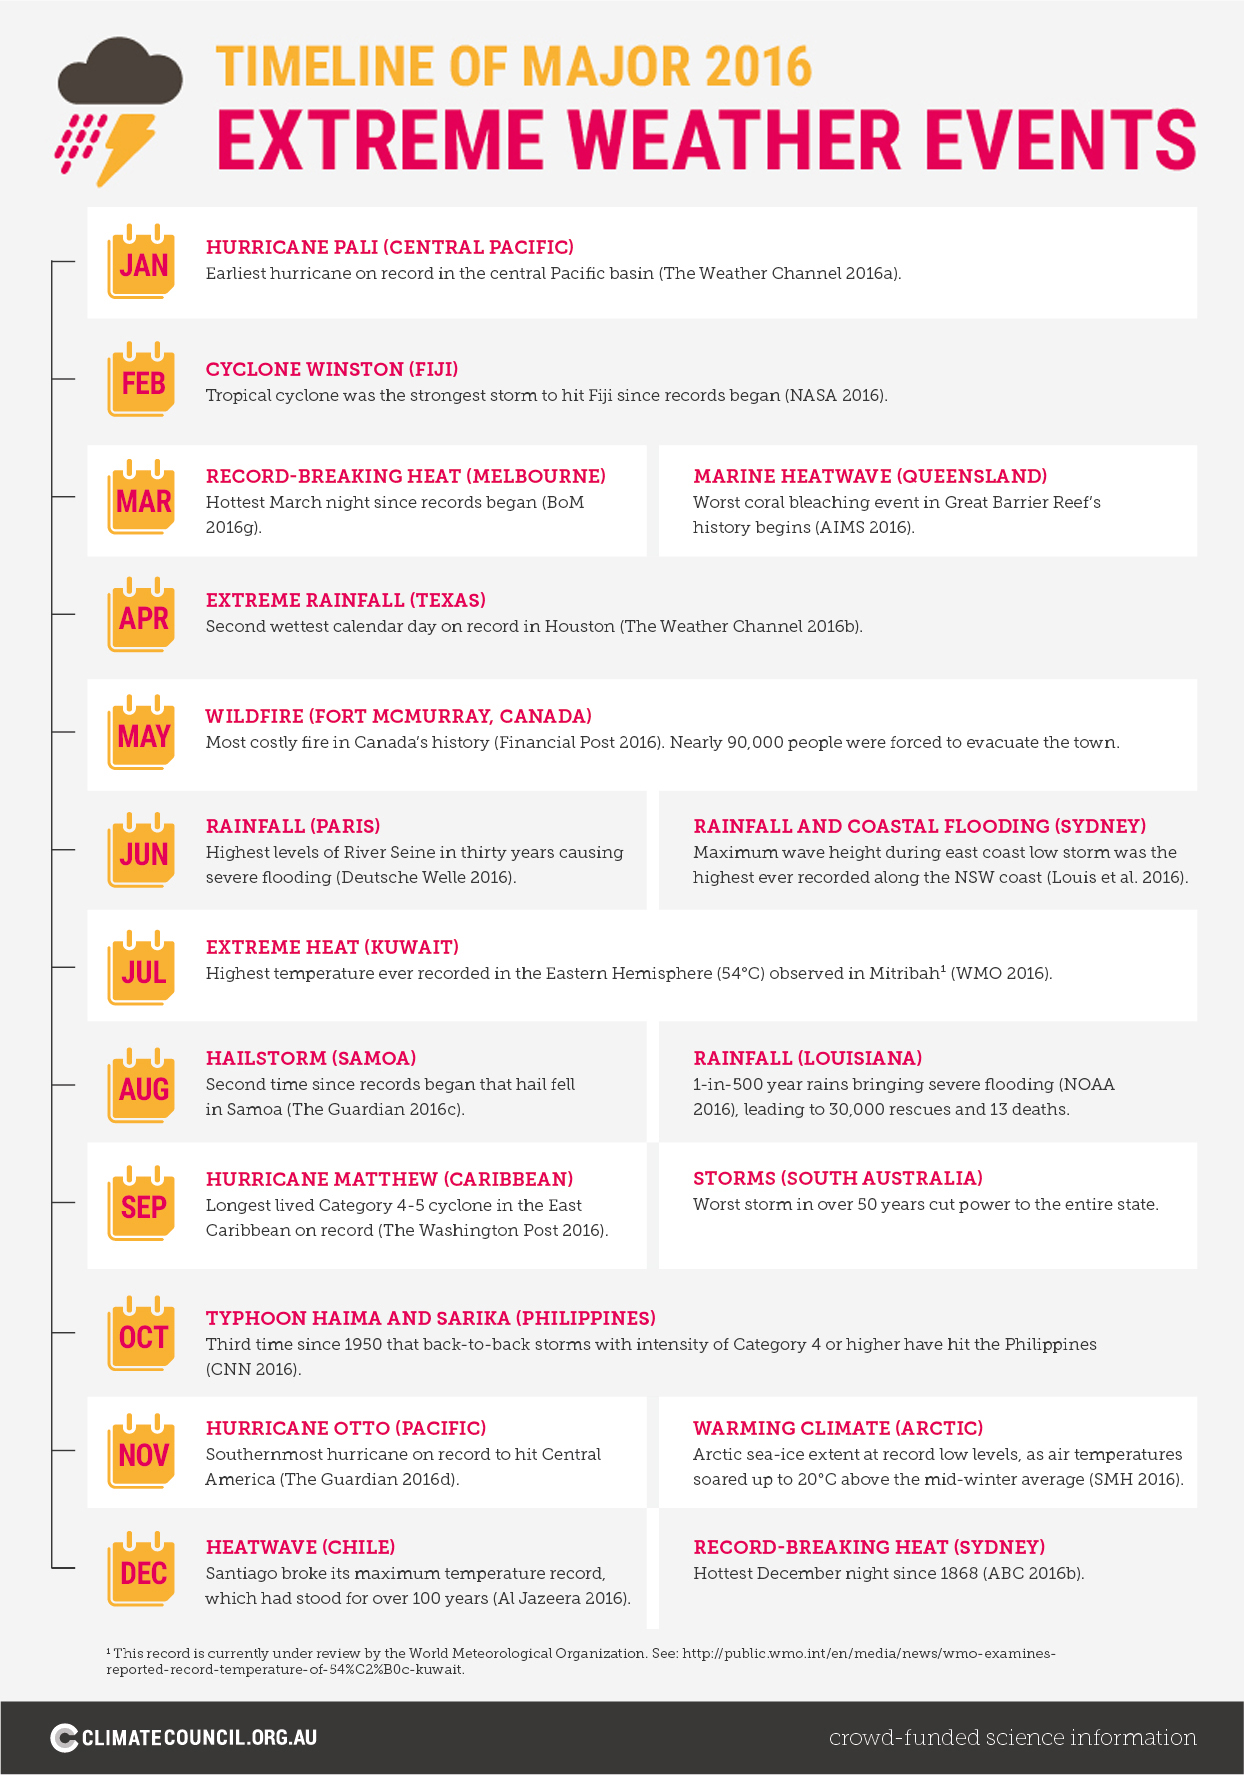
2. Some of the most severe climate impacts the world has experienced have occurred in 2016.

  • Arctic sea ice reached its lowest annual extent on record while record sea surface temperatures drove the worst coral bleaching event in the Great Barrier Reef’s history.
  • Tropical Cyclone Winston was the most intense cyclone to hit Fiji on record, while Hurricane Otto was the southernmost hurricane to hit Central America on record.
  • Canada experienced its costliest wildfire in history in Fort McMurray, forcing the evacuation of almost 90,000 people.
  • The US state of Louisiana experienced 1-in-500 year rains that brought severe flooding leading to 30,000 rescues and 13 deaths.

3. Across Australia, extreme weather events are projected to worsen as the climate warms further.

  • Extreme heat is projected to increase across the entire continent, with significant increases in the length, intensity and frequency of heatwaves in many regions.
  • The time spent in drought is projected to increase across Australia, especially in southern Australia. Extreme drought is expected to increase in both frequency and duration.
  • Southern and eastern Australia are projected to experience harsher fire weather.
  • The intensity of extreme rainfall events is projected to increase across most of Australia.
  • The increase in coastal flooding from high sea level events will become more frequent and more severe as sea levels continue to rise.

4. The impacts of extreme weather events will likely become much worse unless global greenhouse gas emissions are reduced rapidly and deeply.

  • Burning of coal, oil and gas is causing temperatures to rise at unprecedented rates and is making extreme weather events more intense, damaging and costly.
  • Major emitters including China and the European Union are leading action on climate change, but Australia is lagging well behind and is on track to even miss its very weak target of a 26-28% reduction in emissions by 2030.
  • Australia is expected to do its fair share to meet the global emissions reduction challenge by cutting its emissions rapidly and deeply.
  • Phasing out ageing, polluting coal plants and replacing them with clean, efficient renewable energy sources such as wind and solar is imperative for stabilising the climate and reducing the risk of even worse extreme weather events.

Source: The Climate Council

Shale giant looms over National Trust parkland

By Jon Ungoed-Thomas, February 5 2017: One of the world’s biggest manufacturers of chemical and oil products has threatened the National Trust with legal action to force it to allow exploration for shale gas on its land.
Ineos Shale, part of the Ineos Group, which is headed by the billionaire Jim Ratcliffe, is the country’s leading shale gas company. It has government licences that give it access to about 1m acres of potential shale gas reserves.
These includes National Trust land at Clumber Park, near Worksop in Nottinghamshire.
However, the trust has refused access to the historic country park for seismic surveys, arguing that it has “a presumption against fracking on our land” and will not allow access for exploration.
An investigation by Greenpeace into fracking has established that Ineos Shale has threatened the trust with compulsory access to the land under the Mines (Working Facilities and Support) Act 1966.
Tom Pickering, operations director of Ineos Shale, which is based in London, confirmed last week that the company had warned the trust that it could use the act, but said he hoped negotiations would continue.
He said: “If we cannot achieve access by negotiation, then the provisions under this act are available to us and we would pursue them.”
Ineos would require ministerial approval as well as a court order to gain access to the popular park, which consists of 3,800 acres of scenic woodland heath and pasture and boasts a walled garden and the longest double avenue of lime trees in Europe.
The potential legal battle could prove an important test case for the trust’s position on fracking.
Richard Hebditch, the trust’s external affairs director, said the Ineos request for a seismic survey for shale gas was the first on trust land. He said the trust was standing by its decision to turn down the application. He said: “The trust is opposed to fracking on its land and will reject any fracking requests or inquiries.”
One of the main reasons the trust opposes fracking is the fact that it contributes to carbon emissions. However, Ineos argues that gas releases about half the carbon emissions of coal when burnt and claims it can play a key role in helping Britain move towards a greener energy policy.
Ineos has been accused of using “bullying” tactics to gain access to land for surveys. Documents obtained by Greenpeace under freedom of information legislation reveal that the British Geological Society claimed Ineos was using the society’s name without authorisation to persuade landowners to allow it onto their properties.
Ineos said it had investigated and there was no evidence of any bullying tactics or misleading information being given.
Source: Sun Times * http://www.thetimes.co.uk/edition/news/shale-giant-looms-over-national-trust-parkland-3pf6j795g

An Indian chemical plant has figured out how to turn its carbon emissions into baking soda

A chemical plant in India is the first in the world to run a new system for capturing carbon emissions and converting them into baking soda.
The Tuticorin Alkali Chemicals plant, in the industrial port city of Tuticorin, is expecting to convert some 60,000 tonnes of CO2 emissions annually into baking soda and other chemicals – and the scientists behind the process say the technique could be used to ultimately capture and transform up to 10 percent of global emissions from coal.
While carbon capture technology is not a new thing, what’s remarkable about the Tuticorin installation is that it’s running without subsidies from the government – suggesting the researchers have developed a profitable, practical system that could have the commercial potential to expand to other plants and industries.
“I am a businessman. I never thought about saving the planet,” the managing director of the plant, Ramachadran Gopalan, told the BBC.
“I needed a reliable stream of CO2, and this was the best way of getting it.”
The inventors of the new technique, London-based Carbon Clean Solutions, developed the system in the UK after receiving finance from a British entrepreneur support scheme. Their process uses a patented chemical to filter out CO2 molecules.
In the Tuticorin setup, the plant runs a coal-fired burner to make steam that powers its various chemical-manufacturing processes. A mist containing Carbon Clean’s chemical separates the CO2 emissions in the burner’s chimney, which are then fed into a mixing chamber with salt and ammonia.
The end product can then be used to produce baking soda (sodium bicarbonate) or a range of other compounds, for use in things such as glass manufacture, detergents, disinfectants, and sweeteners.
The overall idea of separating CO2 molecules from flue gas may not be new, but the team behind the system say that their filtering chemical is more efficient than the amine compounds that scientists have previously used, and requires less energy to run.
According to CEO Aniruddha Sharma, the company’s approach is to think realistically, partnering with modest, low-risk enterprises as it builds itself up – and he says the same strategy should be implemented by the carbon capture industry as a whole.
“So far the ideas for carbon capture have mostly looked at big projects, and the risk is so high they are very expensive to finance,” Sharma told Roger Harrabin at The Guardian.
“We want to set up small-scale plants that de-risk the technology by making it a completely normal commercial option.”
The other compelling aspect of the system is that it actually does something positive with the carbon – making new chemicals and products – rather than simply storing it somewhere in a useless, dormant state (such as burying it underground).
That distinction is the difference between carbon capture and storage (CCS) and what’s called carbon capture and utilisation (CCU).
And given the expense involved with building carbon capture systems, the ability to on-sell a byproduct could be incredibly important in making this technology financially viable in the bigger picture.
“We have to do everything we can to reduce the harmful effects of burning fossil fuels,” Lord Ronald Oxburgh, the head of the UK government’s carbon capture advisory group, told the BBC, “and it is great news that more ways are being found of turning at least some of the CO2 into useful products.”
Source: http://www.sciencealert.com

Extreme weather linked to climate change is damaging Britain’s favourite places

Lord’s has become the first cricket ground in the country to run on 100% renewable energy, as new figures reveal the increasing disruption to cricket caused by extreme weather patterns linked to climate change.
New statistics released by Marylebone Cricket Club (MCC), owners of Lord’s, illustrate that extreme weather in December 2015, which has been linked to climate change, caused more than £3.5 million worth of damage across 57 cricket clubs. Increased rainfall is also causing significant loss of fixtures in recreational cricket and impacting on the professional game.
The announcement launches the annual “Show The Love” campaign from The Climate Coalition and accompanies the publication of a “Weather Warning” report analysed by the Priestley International Centre for Climate. The report highlights how extreme weather conditions are affecting some of Britain’s favourite places, from gardens and pubs to cliffs and woodlands and churches to cricket pitches.
Professor Piers Forster, Director of the Priestley Centre for Climate, said: “UK weather will always bowl us the odd googly but climate change is making them harder to defend against. The science has now developed to the point where we can say whether the likelihood of a particular bout of weather has been increased by climate change. We know that climate change made the record wet weather in December 2015 considerably more likely. The trend towards more intense rainfall is clear and it’s great to see MCC, ECB and The Climate Coalition raising awareness of these challenges that aren’t just affecting people in other countries but are having impacts right here in the UK.’
Two extreme weather events linked to climate change in the past eight years have caused extensive damage to Wordsworth’s childhood home whilst the iconic chalk cliffs at Birling Gap have seen increased rates of erosion due to heavy rainfall, sea-level rise and an increase in the regularity of storm events. The report also found that Slimbridge Wetlands Centre in Gloucestershire, founded by Sir Peter Scott, has recorded changes in bird species at the centre which have been linked to changes in temperature.
Read The Climate Coalition’s press release: ShowTheLoveLordsLaunchPR
Read the Weather Warning report: Weather warning report

Renewables: Europe on track to reach its 20% target by 2020

Brussels, 1 February 2017: EU Renewable energy progress report just published

How is Europe performing in renewable energy?
Having achieved a share of 16% renewables in its final energy consumption in 2014 and an estimated share of close to 16.4% in 2015, the EU as a whole is well on track to reach its 20% target by 2020. However, Member States will have to keep up their efforts in order to reach their national goals.
Europe as a whole is performing well in its deployment of renewables. In 2011, renewables generated 21.7% of the EU’s electricity; three years later, this figure has reached 27.5%, and it is expected to climb to 50% by 2030. The EU’s initial efforts in promoting the use of renewables facilitated this continued growth which resulted in lowered renewable costs: the prices of photovoltaic modules fell by 80% between the end of 2009 and the end of 2015. Renewables have now become cost-competitive, and sometimes even cheaper than fossil fuels.
The renewable energy sector plays a key role for the EU economy with a turnover of around €144bn in 2014 and more than one million people employed.
European investments have dropped by more than half since 2011 to €44bn last year, while global investments in renewable energy continue to increase to above €260bn.

Why are renewables a key component of the Energy Union strategy and of EU leadership?
The Renewable Energy Directive[1] has been and will continue to be a central element of the Energy Union policy and a key driver for providing clean energy for all Europeans, with the aim of making the EU world number one in renewables – and it is relevant to all five dimensions of the Energy Union.

  1. Renewables have played a major role in energy security. Their estimated contribution to fossil fuel import savings in 2015 was €16bn and it is projected to be €58bn in 2030.[2]
  2. Thanks to fast decreasing costs, renewables can gradually be integrated into the market. The recast of the Renewables Directive together with the Market Design proposals[3] will further enable the participation of renewables on an equal footing to other energy sources.
  3. Renewables go hand in hand with energy efficiency. In the electricity sector, fuel switching from combustible fossil fuels to non-combustible renewables could reduce primary energy consumption.[4] In the building sector, renewables solutions can improve the energy performance of buildings in a cost-effective way.
  4. Renewables are one of the pillars of decarbonisation. In 2015, renewables contributed to reducing EU greenhouse gas (GHG) emissions by 436 MtCO2eq, the equivalent of the emissions of Italy.[5]
  5. Renewables play a major role in making the EU a global leader in innovation. With EU countries holding 30% of patents in renewables globally, the EU has been a pioneer in this field and is committed to prioritising research and innovation to further drive the energy transition.

What is the role of renewables in reaching the Paris climate goals?
At the 2015 Climate Change Conference in Paris, Europe committed itself to contributing to limiting the global rise in temperature to only 1.5°. Renewables, together with energy efficiency, are key to reaching this goal.

Will Europe reach its binding target of at least 27% renewables by 2030?
The Clean Energy for All Europeans package, presented by the Commission last November, contains the main provisions to enable Member States to collectively reach the target of at least 27% renewable energy by 2030. This will be made possible through coordinated action in renewables, energy efficiency, and market design, and ensured through a strong governance process.

Do Member States’ performances differ significantly?
In 2009, the Renewable energy directive (2009/28/EU) defined renewable energy and renewable transport targets, as well the pathway that each Member State should follow to reach them.[6]
In 2014 all EU countries except one[7] showed a renewable energy share which was equal to or higher than their indicative pathway. In 2015, 25 Member States exceeded their indicative pathways, with some even surpassing their 2020 targets.

Can interconnections bridge these differences?
Interconnections can facilitate power exchange between Member States, thus reducing congestion and making renewables more profitable in certain areas. With targets of 10% of installed electricity production capacity by 2020 and 15% by 2030, interconnections will not only facilitate power exchange and improve price signals but also reinforce security of supply and guarantee a European approach to renewable power.

Can we say that the European economy is growing thanks to renewables?
With a turnover of around €144bn in 2014, the renewables industry is indeed a major contributor to the EU economy.
In terms of job creation, renewables also have an added value since renewable energy creates more jobs per unit of energy generated than, for example, fossil fuels.
Moreover, renewables are local: the renewable economy depends very little on imported fuels and material, and therefore the added value is kept at EU level and results in contributions to economic growth.

Is Europe spending or saving thanks to renewables deployment?
Renewable energy should be seen as an investment, rather than an expense.
At a micro level, renewables reimburse the upfront costs of installation with operation and maintenance expenditure that is usually substantially lower than that of fossil alternatives. Moreover, once the technology has been installed, renewables such as wind and solar remain available virtually free of charge.
At a macro, EU level, renewables reduced the EU’s energy import bill by around €16bn in 2015: this could grow to around €58bn by 2030. As in the area of energy efficiency, renewables are therefore a profitable long-term investment that will bring future benefits and independence.

Have renewables made a difference to consumers’ bills?
Renewables have lowered European costs at a wholesale level, but benefits for consumersare yet to come:

  • At a wholesale level, the more we use renewables, the cheaper electricity will become. Every percentage increase in renewables’ share of the market will decrease the market price by €0.4 per megawatt-hour[8].
  • At a domestic level, the share of EU taxes and levies used to support renewable energy and combined heat and power has steadily increased. The share of renewables and combined heat and power support costs ranged from 0% to 23% of the retail electricity price in 2015, depending on the Member State.

How do renewables empower consumers to become active market participants?
Consumers are the drivers of energy transition. The distributed nature of renewables, the increasingly competitive costs of renewable technologies, and new developments in smart grids, smart homes, and battery storage solutions make it possible for energy consumers – both at a domestic and an industrial level – to become active players on the market:

  • In Germany, a typical four-person family household can save almost €680 each year on its annual electricity costs by installing a 4 kWp PV system;
  • In Italy, an average household can save about €720 per year on its electricity bill, with a pay-back period of about 7-9 years, depending on the region;[9]
  • Small- and medium-sized enterprises can also benefit from renewables. For example, an Italian food-processing company installed a rooftop solar panel on its production facility and used 89% of the solar panel electricity produced on site (this is known as the self-consumption rate). This resulted in an annual electricity bill saving of about 35% and an annual reduction in CO2 emissions of over 200 tons.[10]

How will further clean energy transition take place?
The “Clean Energy for All Europeans” package includes provisions to support the energy transition towards higher shares of renewables, especially in the buildings, transport and industry sectors. To this extent, it identifies several key areas for action:

  1. Strengthening the regulatory certainty for investments by further “Europeanising” renewables policy. This will further encourage deployment of renewables in particular in the Electricity sector;
  2. Mainstreaming renewables in the Heating and Cooling sector;
  3. Decarbonising and diversifying the Transport sector;
  4. Empowering and informing consumers;
  5. Strengthening the EU sustainability criteria for bioenergy;
  6. Making sure that the EU level binding target is achieved on time and in a cost-effective way.

Who will pay for it?
While global investments in renewable energy continue to increase to above €260bn, European investments have dropped by more than half since 2011 to €44bn last year. Today, the EU accounts for only 18%[11] of total global investment in renewables, down from close to 50% only six years ago.
New sources of investments need to be unlocked to reach the €379bn of investment needed on an annual basis to achieve the EU’s climate and energy targets:

  • Currently, 25% of the €154bn allocated under the European Fund for Strategic Investments is linked to energy where renewable energy is among the priorities; furthermore, €27bn per year is devoted to public and private research and development and innovation in Energy Union-related areas, to support concrete industrial and economic opportunities.
  • The European Fund for Strategic Investments will be strengthened and expanded to the end of 2020, thereby increasing the total investment target from €314bn to at least €500bn. New, innovative funding mechanisms under the EFSI and the Connecting Europe Facility will help to achieve this.

What’s the link between the Energy Union strategy and the recently adopted ‘Clean Energy Package’?
In the Energy Union Strategic Framework[12], the European Union commits itself to become the world leader in renewable energy, and the global hub for developing the next generation of technically advanced and competitive renewable energies. The EU has also set a target that at least 27% of the energy consumed in the EU in 2030 should be from renewable sources.
The ‘Clean Energy Package’ presents regulatory proposals and facilitating measures that aim to achieve these objectives, and at the same time accelerate, transform and consolidate the EU economy’s clean energy transition, thereby creating jobs and growth in new economic sectors and business models.
In addition to the legislative proposal on renewable energy, the package also includes proposals on energy efficiency, the design of the electricity market, security of supply and governance rules for the Energy Union that will help facilitate the Energy Union strategic framework.
The facilitating actions include initiatives to accelerate clean energy innovation and to renovate Europe’s buildings, as well as measures to encourage public and private investment and make the most of the available EU budget; to promote industry-led initiatives to foster competitiveness; to mitigate the social impact of the clean energy transition; to involve multiple players including Member State authorities and local and city authorities as well as businesses, social partners and investors; and to maximise Europe’s leadership in clean energy technology and services to help third countries achieve their policy goals.
What benefits can increased use of renewables bring to

…consumers? Solar and wind technology prices have declined by 80% and 30-40% respectively between 2009 and 2015.[13] This cost reduction is increasingly enabling consumers to produce their own renewable energy. With the revised directive, consumers will benefit from greater rights to:

  1. produce their own electricity, and feed any excess back to the grid;
  2. organise themselves into renewable energy communities to generate, consume, store and sell renewable energy;
  3. stop buying heat/cold from a district heating/cooling system if they can achieve significantly better energy performances themselves.

…the environment? The revised renewable energy directive will help fight climate change by reducing greenhouse gas (GHG) emissions. Reaching at least 27% renewables will help reduce GHG emissions to meet our target of at least 40% GHG reduction by 2030. Together with energy efficiency, the EU Emission Trading Scheme (ETS) and other climate change mitigation policies, renewables could help the EU reduce its carbon intensity by up to one third between 2020 and 2030.[14]
Furthermore, the revised directive contains a set of reinforced sustainability criteria for bioenergy, with the view to maximising climate and environmental benefits and avoiding the risk of biomass production resulting in deforestation or forest degradation.
…industry? The clearer legal framework provided by the new directive willremove uncertainties for investors, reduce administrative burdens, and decrease costs. This will bring benefits for both producers and investors: renewable energy technology suppliers will keep a leadership role, and the costs of renewables supply chains will be lowered.

…jobs? The new directive focuses on creating the right conditions for renewables to thrive and make the EU a flourishing market for clean energy. The sector already employs more than one million people and accounts for €144bn revenue every year.
Implementing our Energy Union policies could bring up to 900 000 net additional jobs in the EU economy by 2030 compared to the reference scenario.[15]

…energy security? In 2014, the deployment of renewable energy cut around €20bn worth of fossil fuel imports. Thanks to renewables, Europe could save around €58bn per year by 2030 in terms of avoided fossil fuel imports.[16] This is the equivalent to the current Gross Domestic Product (GDP) of Luxembourg.

What’s coming next?
Until 2020, EU Member States will have to continue to maintain or increase their renewable energy shares to ensure that they achieve their national renewable energy targets for 2020.
In line with the Joint Declaration setting out the EU’s objectives and priorities for the legislative process in 2017, the Energy Union-related legislative proposals presented by the Commission such as those included in the Clean Energy for All Europeans package should be addressed this year as a priority by the European Parliament and Council.
 
Overview of Member States’ progress towards 2020 targets in renewable energy (%)

Member State RES Share
2013
Average RES Share 2013/2014 RED indicative trajectory (2013/2014) RES Share 2014 RES Share 2015 (proxy) RED indicative trajectory (2015/2016)
  %
AT 32,3% 32,7% 26,5% 33,1% 33,6% 28,1%
BE 7,5% 7,8% 5,4% 8,0% 7,3% 7,1%
BG 19,0% 18,5% 11,4% 18,0% 18,4% 12,4%
CY 8,1% 8,5% 5,9% 9,0% 9,1% 7,4%
CZ 12,4% 12,9% 8,2% 13,4% 13,6% 9,2%
DE 12,4% 13,1% 9,5% 13,8% 14,5% 11,3%
DK 27,3% 28,2% 20,9% 29,2% 30,6% 22,9%
EE 25,6% 26,0% 20,1% 26,5% 27,9% 21,2%
EL 15,0% 15,2% 10,2% 15,3% 15,5% 11,9%
ES 15,3% 15,8% 12,1% 16,2% 15,6% 13,8%
FR 14,0% 14,2% 14,1% 14,3% 14,5% 16,0%
FI 36,7% 37,7% 31,4% 38,7% 39,5% 32,8%
HR 28,1% 28,0% 14,8% 27,9% 27,5% 15,9%
HU 9,5% 9,5% 6,9% 9,5% 9,4% 8,2%
IE 7,7% 8,2% 7,0% 8,6% 9,0% 8,9%
IT 16,7% 16,9% 8,7% 17,1% 17,1% 10,5%
LT 23,0% 23,4% 17,4% 23,9% 24,3% 18,6%
LU 3,6% 4,1% 3,9% 4,5% 5,0% 5,4%
LV 37,1% 37,9% 34,8% 38,7% 39,2% 35,9%
MT 3,7% 4,2% 3,0% 4,7% 5,3% 4,5%
NL 4,8% 5,2% 5,9% 5,5% 6,0% 7,6%
PL 11,3% 11,4% 9,5% 11,4% 11,8% 10,7%
PT 25,7% 26,3% 23,7% 27,0% 27,8% 25,2%
RO 23,9% 24,4% 19,7% 24,9% 24,7% 20,6%
SE 52,0% 52,3% 42,6% 52,6% 54,1% 43,9%
SI 22,5% 22,2% 18,7% 21,9% 21,8% 20,1%
SK 10,1% 10,9% 8,9% 11,6% 11,9% 10,0%
UK 5,6% 6,3% 5,4% 7,0% 8,2% 7,5%
EU-28 15,0% 15,5% 12,1% 16,0% 16,4% 13,8%

Source: Directive 2009/28/EC; Eurostat SHARES 2014; EEA RES proxy (2015); PRIMES (2020, 2025, 2030)
 
For further information:
IP/17/161
MEMO/17/162 on Progress Energy Efficiency
 
 
[1]Directive 2009/28/EC on the promotion of the use of energy from renewable sources, OJ L 140, 5.6.2009.
[2] Compared with 2005 baseline, EC Renewable Energy Progress Report
[3] As part of the “Clean Energy for All Europeans” package, issued on 30 November 2016.
[4] Assuming a Primary Energy Factor of 2.5, 1 unit of renewable could replace 2.5 units of fossil electricity.
[5] Compared with 2005 baseline. Source:EEA
[6] Under its Annex I
[7]The Netherlands – it has informed the Commission on the adoption of new measures to regain its trajectory and ensure compliance with its target.
[8] SWD (2016) 420. Energy prices and costs in Europe.
[9] SWD (2015) 141. Best practices on renewable energy self-consumption.
[10] SWD (2015) 141. Best practices on renewable energy self-consumption.
[11] Frankfurter School-UNEP Centre/BNEF, 2016. Global Trends in Renewable Energy Investments 2016, http://www.fs-unep-centre.org.
[12] COM (2015) 80. Energy Union Package.
[13] IRENA (2016). The Power to Change: Solar and Wind Cost Reduction Potential to 2025.
[14] Based on PRIMES EUCO30 scenario, carbon intensity of GDP (t of CO2/M€13).
[15] Where 2030 targets would not be met
[16]Compared with 2005 baseline, interim renewable energy progress report, [to be published]

MEMO/17/163

Press contacts:

General public inquiries: Europe Direct by phone 00 800 67 89 10 11 or by email

WRMA to Hold Weather Risk Symposium as Official Supporter of InterMET Asia

Washington, DC (Monday, February 6, 2017) – The Weather Risk Management Association (WRMA) will hold a half-day Weather Risk Management Symposium on March 21, 2017 in conjunction with the 2017 InterMET Asia – Extreme Weather Expo Conference in Singapore.
As an official supporter of the InterMET Extreme Weather Expo Conference, WRMA has compiled an impressive lineup of industry experts to provide attendees a complete treatment of the weather risk industry. The WRMA Weather Risk Management Symposium will begin with an introductory session for those less familiar with the industry, to lend context as to how weather challenges a wide spectrum of businesses whose revenues, costs, and financial performance are sensitive to weather.
“The weather risk management market is positioned at the intersection of the financial engineering and scientific communities,” said Bradley Hoggatt, MSI GuaranteedWeather, WRMA President. “The WRMA symposium is a chance for those in our industry as well as related industries to hear from and engage with weather risk experts.”
The sessions will address key drivers that have shaped the marketplace, predictions regarding future products, and required supporting data and analytics. Speakers will utilize illustrative case study examples to provide perspective and generate discussion as to how new data sources and modelling techniques can facilitate increased hedge effectiveness and uptake of weather risk management products.
Topics and speakers on the agenda for the WRMA Weather Risk Management Symposium include:
•    “Weather Risk Management: The Confluence of Weather/Climate Science and Financial Engineering” – Brad Hoggatt, MSI Guaranteed Weather
•    “Case Study 1: Managing Weather Risk in the Energy Sector” – Richard Betts, Uniper Global Commodities and Ralph Renner, Endurance Re
•    “Case Study 2: Weather Risk Management in the Agriculture Sector Including Applications for Natural Catastrophes” – Sandeep Ramachandran, Axis Specialty Markets Ltd, and Jonathan Barratt, CelsiusPro Australia
•    “Case Study 3: Management of Weather Risks in Other Industry Sectors” – Ralph Renner, Endurance Re,  Claire Wilkinson, Willis Towers Watson, and   Richard Zhang, Willis Towers Watson
•    “Technology: Accessing Weather Risk Protection”– David Whitehead, weatherXchange
Download the WRMA Symposium Programme >>
Registration for the free-to-attend WRMA Symposium can be completed via the InterMET Asia website >> and click ‘Register for the Exhibition’.
For more information on the Symposium visit WRMA’s event page >>
For details about the full InterMET – Extreme Weather Expo conference programme, click here >>
About WRMA
WRMA is the industry association for weather risk management professionals. WRMA strives to enhance public awareness of the weather risk industry and promote the growth and general welfare of the weather risk market. For more information on WRMA activities, programs, and initiatives, please visit us at www.wrma.org

Billion-Dollar Weather and Climate Disasters: Overview

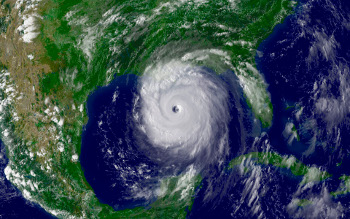
Hurricane Katrina

(Source: NOAA) The National Centers for Environmental Information (NCEI) is the Nation’s Scorekeeper in terms of addressing severe weather and climate events in their historical perspective. As part of its responsibility of monitoring and assessing the climate, NCEI tracks and evaluates climate events in the U.S. and globally that have great economic and societal impacts. NCEI is frequently called upon to provide summaries of global and U.S. temperature and precipitation trends, extremes, and comparisons in their historical perspective. Found here are the weather and climate events that have had the greatest economic impact from 1980 to 2016. The U.S. has sustained 203 weather and climate disasters since 1980 where overall damages/costs reached or exceeded $1 billion (including CPI adjustment to 2016). The total cost of these 203 events exceeds $1.1 trillion.

2016 in Context…

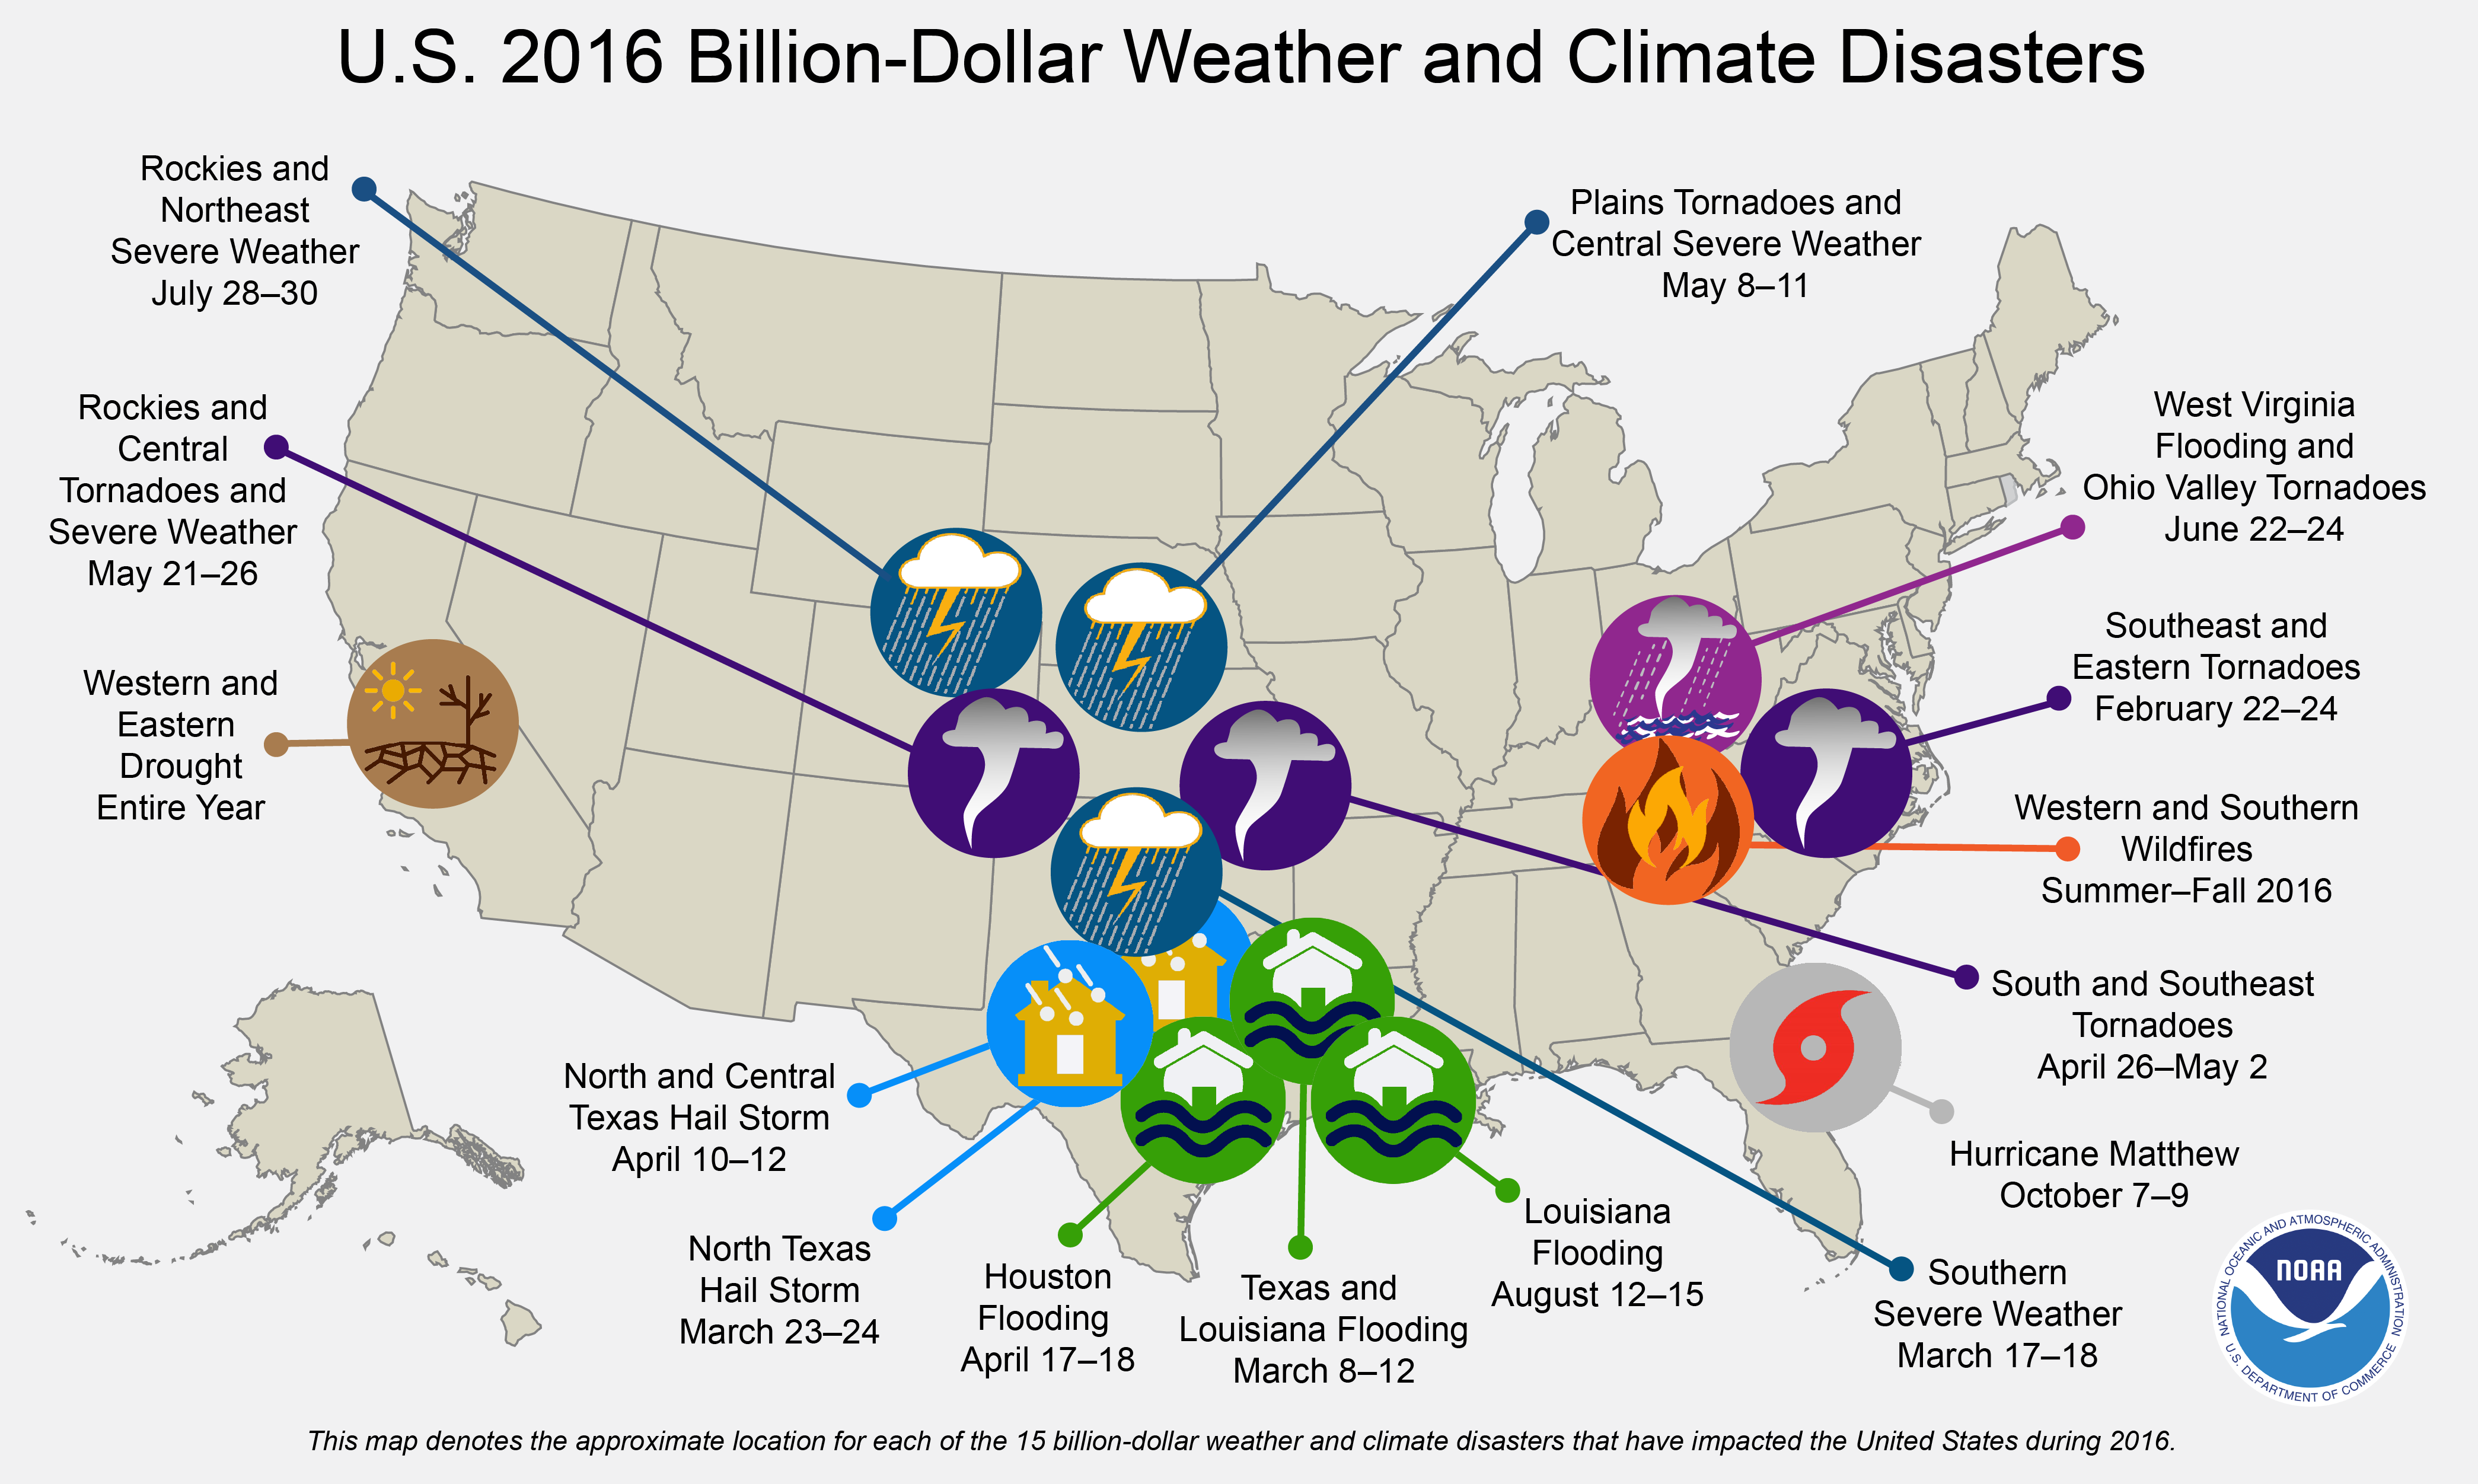
In 2016, there were 15 weather and climate disaster events with losses exceeding $1 billion each across the United States. These events included a drought event, 4 flooding events, 8 severe storm events, a tropical cyclone event, and a wildfire event. Overall, these events resulted in the deaths of 138 people and had significant economic effects on the areas impacted. The 1980–2016 annual average is 5.5 events (CPI-adjusted); the annual average for the most recent 5 years (2012–2016) is 10.6 events (CPI-adjusted).

Icon Map

Three new billion-dollar disaster events were added during the 4th quarter, bringing the 2016 total to 15 events. This represents the 2nd highest total number of events surpassing the 11 events observed in 2012. The record number of events in one year (since 1980) is 16, as observed in 2011.
The U.S. has also experienced 4 billion-dollar inland flood events during 2016, doubling the previous record, as no more than 2 inland flood events have occurred in a year since 1980. This is a notable record, further highlighted by the numerous other record flooding events that have impacted the U.S. in 2016.

Methodology and Data Sources

In 2012, NCEI — then known as National Climatic Data Center (NCDC) — reviewed its methodology on how it develops Billion-dollar Disasters. NCEI held a workshop with economic experts (May, 2012) and worked with a consulting partner to examine possible inaccuracy and biases in the data sources and methodology used in developing the loss assessments (mid-2013). This ensures more consistency with the numbers NCEI provides on a yearly basis and give more confidence in the year-to-year comparison of information. Another outcome is a published peer-reviewed article “U.S. Billion-dollar Weather and Climate Disasters: Data Sources, Trends, Accuracy and Biases” (Smith and Katz, 2013). This research found the net effect of all biases appears to be an underestimation of average loss. In particular, it is shown that the factor approach can result in an underestimation of average loss of approximately 10–15%. This bias was corrected during a reanalysis of the loss data to reflect new loss totals.
It is also known that the uncertainty of loss estimates differ by disaster event type reflecting the quality and completeness of the data sources used in our loss estimation. In 2016, six of the fifteen billion-dollar events (i.e., the 4 inland flooding events, drought and Hurricane Matthew) have higher potential uncertainty values around the loss estimates due to less coverage of insured assets. The remaining nine events (i.e., 8 severe storm events and wildfire) have lower potential uncertainty surrounding their estimate due to more complete insurance coverage. Our newest research defines the cost uncertainty using confidence intervals as discussed in the peer-reviewed article “Quantifying Uncertainty and Variable Sensitivity within the U.S. Billion-dollar Weather and Climate Disaster Cost Estimates” (Smith and Matthews, 2015). This research is a next step to enhance the value and usability of estimated disaster costs given data limitations and inherent complexities.
In performing these disaster cost assessments these statistics were taken from a wide variety of sources and represent, to the best of our ability, the estimated total costs of these events — that is, the costs in terms of dollars that would not have been incurred had the event not taken place. Insured and uninsured losses are included in damage estimates. Sources include the National Weather Service, the Federal Emergency Management Agency, U.S. Department of Agriculture, other U.S. government agencies, individual state emergency management agencies, state and regional climate centers, media reports, and insurance industry estimates.

References

Citing this information:

NOAA National Centers for Environmental Information (NCEI) U.S. Billion-Dollar Weather and Climate Disasters (2017). https://www.ncdc.noaa.gov/billions/

Trump’s orders spell winds of change for automakers to renewable energy

It’s been just 11 days since Donald Trump was inaugurated in the US and so far the new president seems set on solidifying the promises he made during his campaign, including some that would impact climate and energy.
The 1,000-mile long wall that Trump intends to build between the US and Mexico would release as much as 1.9m tonnes of carbon dioxide into the atmosphere if it were to be built out of concrete, according to an estimate from Columbia University. Trump signed an executive order last Wednesday to direct the construction of such a wall and to boost the number of patrol forces along it.
Meanwhile, another executive order signed over the weekend to halt immigration from seven Middle Eastern countries could have an impact on companies from General Electric to General Motors – both of which employ immigrants from the nations affected. “We have many employees from the named countries and we do business all over the region,” said Jeff Immelt, CEO of GE, in an internal email. GE is one of the world’s leading wind turbine manufacturers and in 2015 almost 14% of its revenue came from the Middle East and Africa, according to Bloomberg data. GM, maker of the all-electric Chevrolet Bolt and Volt plug-in hybrid, has vast manufacturing operations in Michigan – a state with a substantial Muslim population.
Trump is also likely to follow through on his intention to pull the US out of the landmark climate pact signed by more than 190 nations in Paris in December 2015, according to Myron Ebell, who headed Trump’s Environmental Protection Agency transition team. “President Trump made it clear he would withdraw from the deal,” Ebell said during a press conference in London yesterday. As the world’s richest nation and second largest polluter, US participation in the accord is fundamental to limiting global warming, say climate researchers.
One area that might survive Trump’s protectionist stance is the gas export market between the US and Mexico, according to asset manager ING Groep and Pira Energy Group. Pipeline deliveries of natural gas from the US to Mexico have more than doubled in the past two years, in response to declining oil and gas production in the latter and a supply glut in the former. The market supports jobs in the US and provides Mexico with cheap fuel and so may avert any interventionist measures, say the companies.
In California, large battery storage plants are moving in on the traditional role of natural gas to provide electricity to the grid during peak hours of demand. Three large plants – built by Tesla Motors, AES and Altagas – will go live in southern California this week in order to fill the power glut caused by the natural gas leak at Aliso Canyon in Los Angeles, which was subsequently shut down. The leak emitted 109,000 tonnes of methane into the atmosphere and led to the displacement of thousands of local residents. The battery storage projects have all been completed within six months and will alleviate the risk of winter blackouts.
On the US east coast, the country’s largest offshore wind farm received approval last week, a key milestone on the way to its deployment in waters off Long Island. The 90MW project will generate enough electricity to power 50, 000 homes and is the first step towards New York Governor Andrew Cuomo’s goal to develop 2.4GW of offshore wind by 2030.
In Europe, the offshore wind industry will install more than 3.5GW of capacity this year, according to a forecast by the WindEurope industry group. Germany and the UK will be market leaders – installing more than 1.6GW each, while Belgium will add 165MW and Denmark 23MW. This will add to the continent’s current capacity of 12.6GW of offshore wind.
The market for offshore wind in Polish waters and elsewhere in the Baltic Sea also looks promising, according to a BNEF Research Note that sees a current unfinanced pipeline of as much as 2.5GW. The Baltic region has so far been behind in developing offshore wind due to a lack of supportive policy, low power prices and a ready supply of hydro-electric and nuclear power. Nevertheless, Poland has an auction on the cards for 2017 and at least 200MW of capacity could be commissioned in the country by 2022, the note says.
Taiwan’s market for offshore wind is also heating up following news last week that Dong Energy and Macquarie Capital had both bought stakes in the country’s first commercial-scale offshore project – the 128MW Formosa I wind farm. Macquarie now owns half the project, Dong Energy holds 35% and the initial developer — Swancor Renewable – holds the remainder. Formosa I is expected to be fully built in 2019, subject to a final investment decision.

India’s solar installations to escalate from 2017 onwards (GW of capacity)

India's solar installations to escalate from 2017 onwards (GW of capacity)
Source: Bloomberg New Energy FinanceIndia added 3.85GW of grid-connected solar generation capacity in the first 10 months of 2016 — almost double total installations in 2015. BNEF has revised its projections for subsequent years based on the amount of capacity auctioned in 2016 and anticipated installations in the future. States will be under increasing pressure to meet the renewable purchase obligation targets set out at federal level, which require 6.75% of total electricity consumption across all states to come from solar-powered generation by the end of 2019.

Climate change poses increasingly severe risks for ecosystems, human health and the economy in Europe

 25 Jan 2017: Europe’s regions are facing rising sea levels and more extreme weather, such as more frequent and more intense heatwaves, flooding, droughts and storms due to climate change, according to a European Environment Agency report published today. The report assesses the latest trends and projections on climate change and its impacts across Europe and finds that better and more flexible adaptation strategies, policies and measures will be crucial to lessen these impacts.

Image © JanJBrand/iStockphoto

‘Climate change will continue for many decades to come. The scale of future climate change and its impacts will depend on the effectiveness of implementing our global agreements to cut greenhouse gas emissions, but also ensuring that we have the right adaptation strategies and policies in place to reduce the risks from current and projected climate extremes.’
Hans Bruyninckx, EEA Executive Director

The observed changes in climate are already having wide-ranging impacts on ecosystems, the economy and on human health and well-being in Europe, according to the report ‘Climate change, impacts and vulnerability in Europe 2016’. New records continue to be set on global and European temperatures, sea levels and reduced sea ice in the Arctic. Precipitation patterns are changing, generally making wet regions in Europe wetter and dry regions drier. Glacier volume and snow cover are decreasing. At the same time, climate-related extremes such as heat waves, heavy precipitation and droughts, are increasing in frequency and intensity in many regions. Improved climate projections provide further evidence that climate-related extremes will increase in many European regions.
‘Climate change will continue for many decades to come. The scale of future climate change and its impacts will depend on the effectiveness of implementing our global agreements to cut greenhouse gas emissions, but also ensuring that we have the right adaptation strategies and policies in place to reduce the risks from current and projected climate extremes,’ said Hans Bruyninckx, EEA Executive Director.

Climate change hotspots

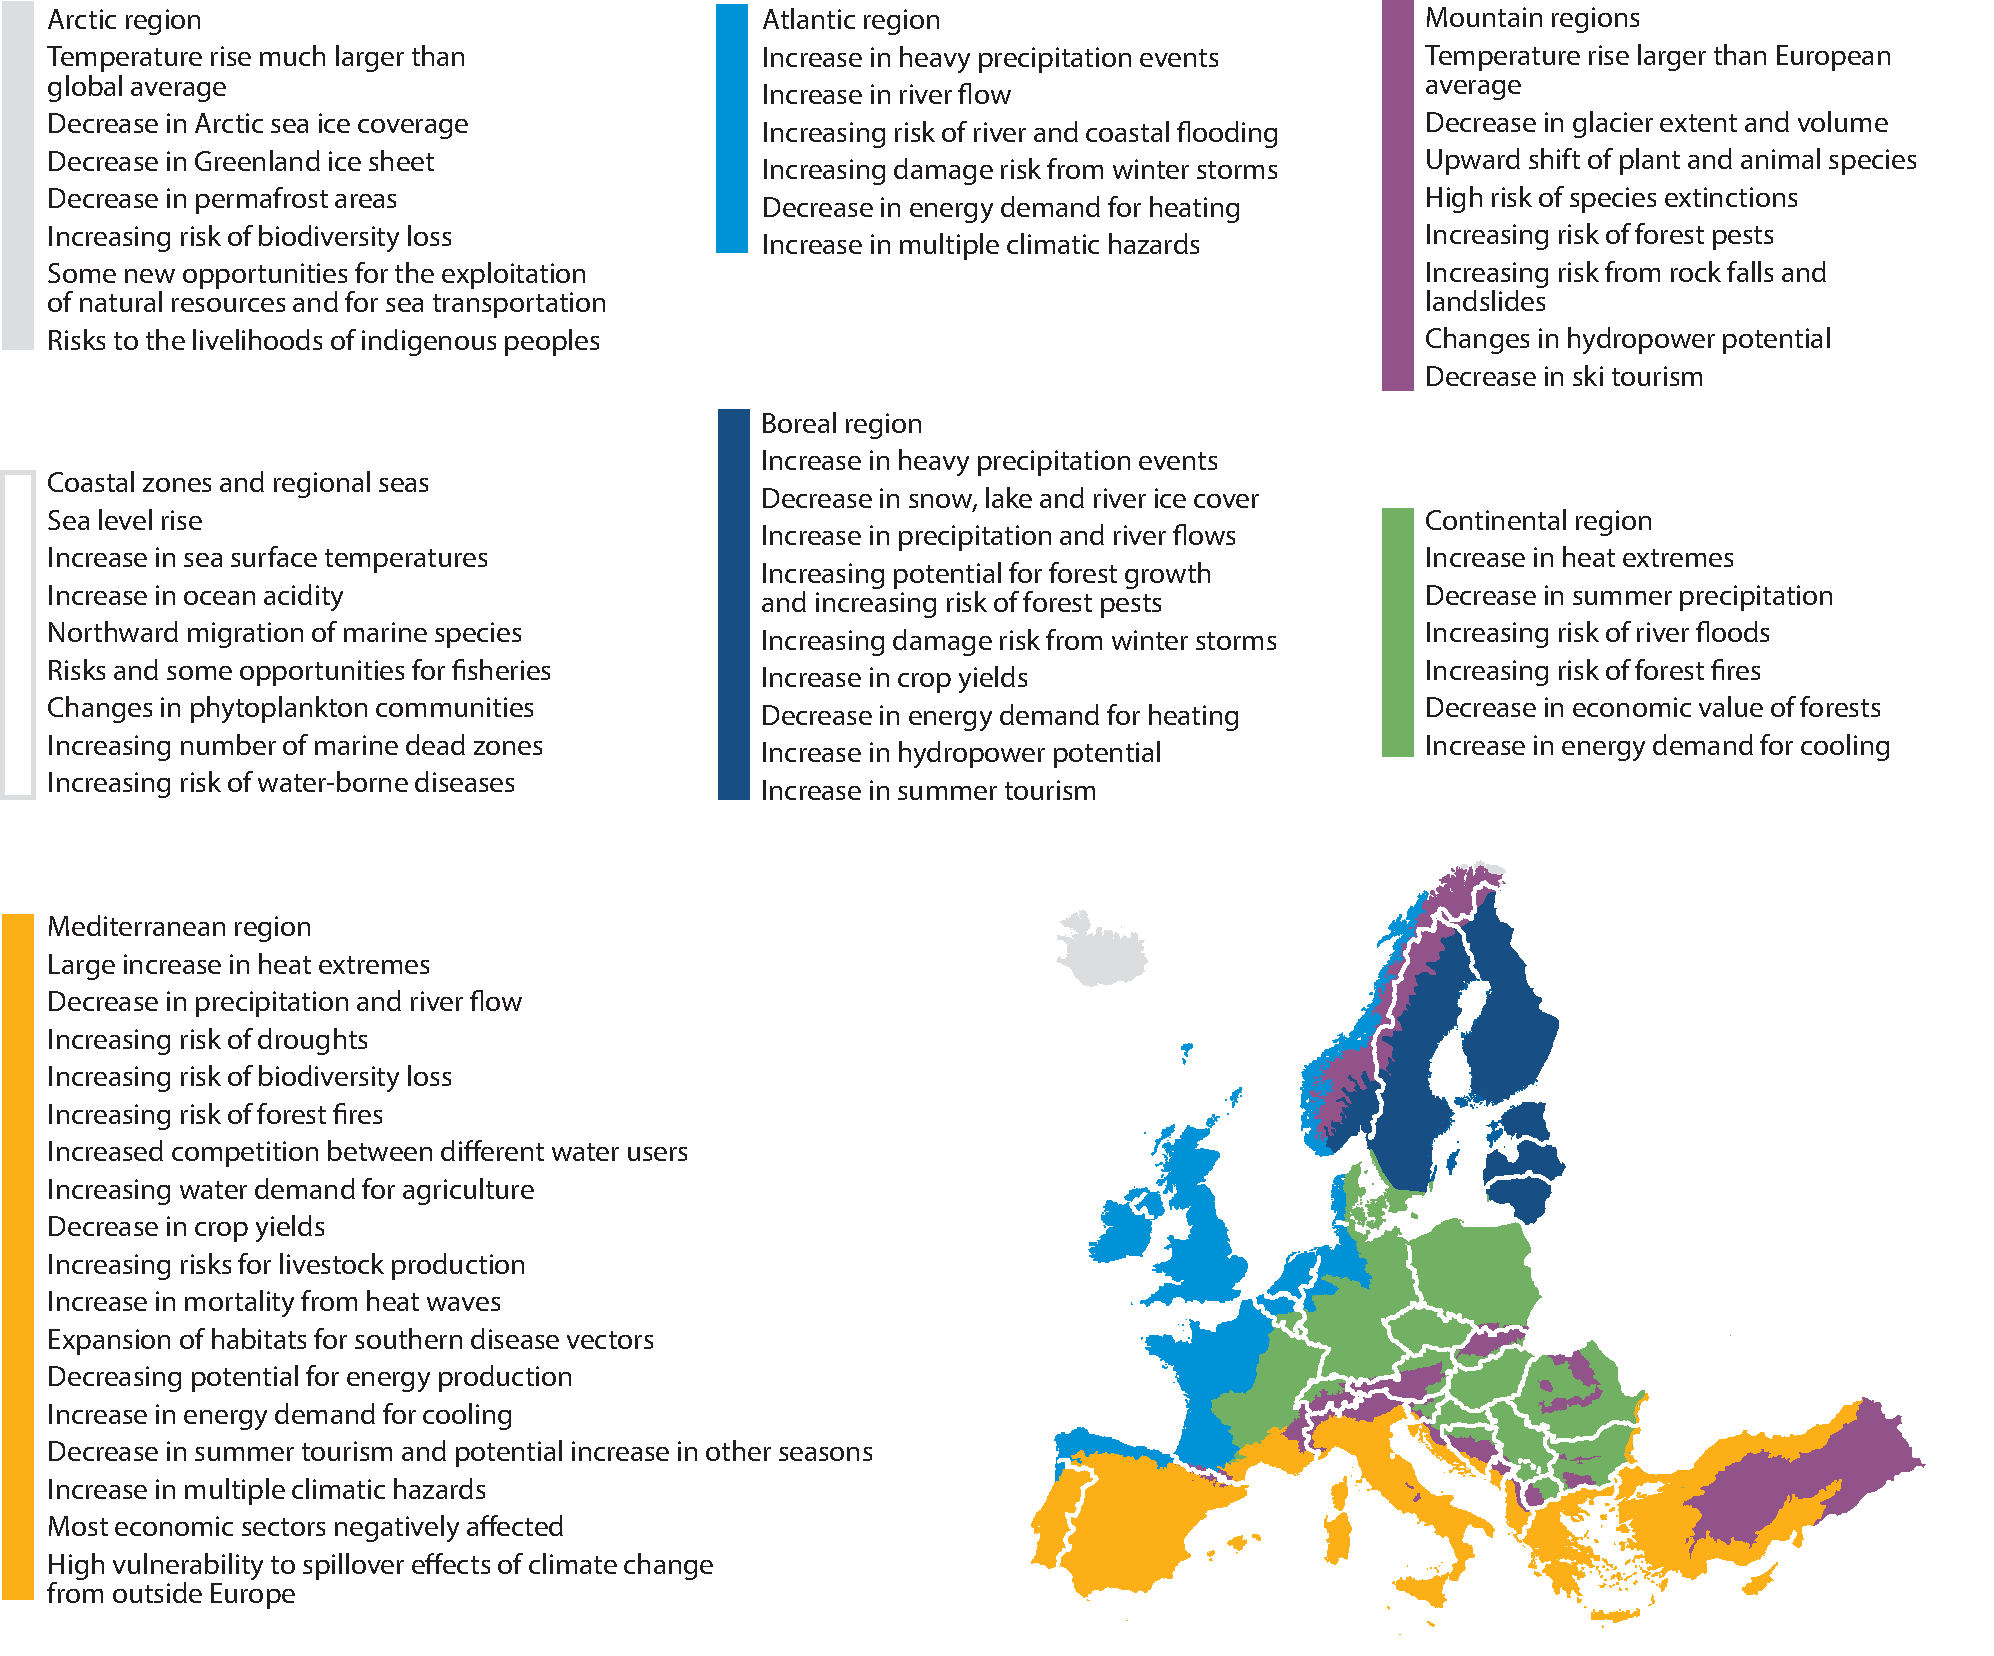
All European regions are vulnerable to climate change, but some regions will experience more negative impacts than others. Southern and south-eastern Europe is projected to be a climate change hotspot, as it is expected to face the highest number of adverse impacts. This region is already experiencing large increases in heat extremes and decreases in precipitation and river flows, which have heightened the risk of more severe droughts, lower crop yields, biodiversity loss and forest fires. More frequent heat waves and changes in the distribution of climate-sensitive infectious diseases are expected to increase risks to human health and well-being.
Coastal areas and floodplains in western parts of Europe are also seen as hotspots as they face an increased risk of flooding from rising sea levels and a possible increase in storm surges. Climate change is also leading to major changes in marine ecosystems as a result of ocean acidification, warming and the expansion of oxygen-depleted dead zones.
Ecosystems and human activities in the Arctic will also be strongly affected owing to the particularly rapid increase in air and sea temperatures and the associated melting of land and sea ice.
Although some regions may also experience some positive impacts, such as improving conditions for agriculture in parts of northern Europe, most regions and sectors will be negatively affected.

Map ES.1 Key observed and projected climate change and impacts for the main biogeographical regions in Europe

Europe’s regions are facing rising sea levels and more extreme weather, such as more frequent and more intense heatwaves, flooding, droughts and storms due to climate change, according to a European Environment Agency report published today. The report assesses the latest trends and projections on climate change and its impacts across Europe and finds that better and more flexible adaptation strategies, policies and measures will be crucial to lessen these impacts.
Source: EEA, 2017

Ecosystems, human health and economy

Ecosystems and protected areas across Europe are under pressure from climate change and other stressors, such as land use change. The report highlights that the impacts of climate change are a threat to biodiversity at land and in the seas. Many animal and plant species are experiencing changes to their life cycles and are migrating northwards and to higher altitudes, while various invasive species have established themselves or have expanded their range. Marine species, including commercially important fish stocks, are also migrating northwards. These changes affect various ecosystem services and economic sectors such as agriculture, forestry and fisheries.
The main health effects of climate change are linked to extreme weather events, changes in the distribution of climate-sensitive diseases, and changes in environmental and social conditions. River and coastal flooding has affected millions of people in Europe in the last decade. The health effects include injuries, infections, exposure to chemical hazards and mental health consequences. Heatwaves have become more frequent and intense, leading to tens of thousands of premature deaths in Europe. This trend is projected to increase and to intensify, unless appropriate adaptation measures are taken. The spread of tick species, the Asian tiger mosquito and other disease carriers increases the risk of Lyme disease, tick-borne encephalitis, West Nile fever, dengue, chikungunya and leishmaniasis.
The economic costs of climate change can be very high. Climate-related extreme events in EEA member countries account for more than EUR 400 billion of economic losses since 1980. Available estimates of the future costs of climate change in Europe consider only some sectors and show considerable uncertainty. Still, the projected damage costs from climate change are highest in the Mediterranean region. Europe is also affected by climate change impacts occurring outside Europe through trade effects, infrastructure, geopolitical and security risks, and migration.

Enhancing adaptation and knowledge

Mainstreaming of climate change adaptation into other policies is progressing but can be further enhanced. Other possible further actions include improving policy coherence across different policy areas and governance levels (EU, transnational, national and subnational), more flexible adaptive management approaches, and the combination of technological solutions, ecosystem-based approaches and ‘soft’ measures.
The development and use of climate and adaptation services are increasing in Europe. Improved knowledge would be useful in various areas, for example, on vulnerability and risk assessments at various scales and on monitoring, reporting and evaluation of adaptation actions, their costs and benefits, and synergies and trade-offs with other policies.

Background

The report is an indicator-based assessment of past and projected climate change and its impacts on ecosystems and society. It also looks at society’s vulnerability to these impacts and at the development of adaptation policies and the underlying knowledge base.
The report was developed by the EEA in collaboration with the Joint Research Centre of the European Commission, the European Centre for Disease Prevention and Control, the World Health Organisation Regional Office for Europe and three European Topic Centres (ETC-CCA, ETC-BD, ETC-ICM). This is the fourth ‘Climate change, impacts and vulnerability in Europe’ report, which is published every four years. This edition aims to support the implementation and review process of the 2013 EU Adaptation Strategy, which is foreseen for 2018, and the development of national and transnational adaptation strategies and plans.